Fig. 9.
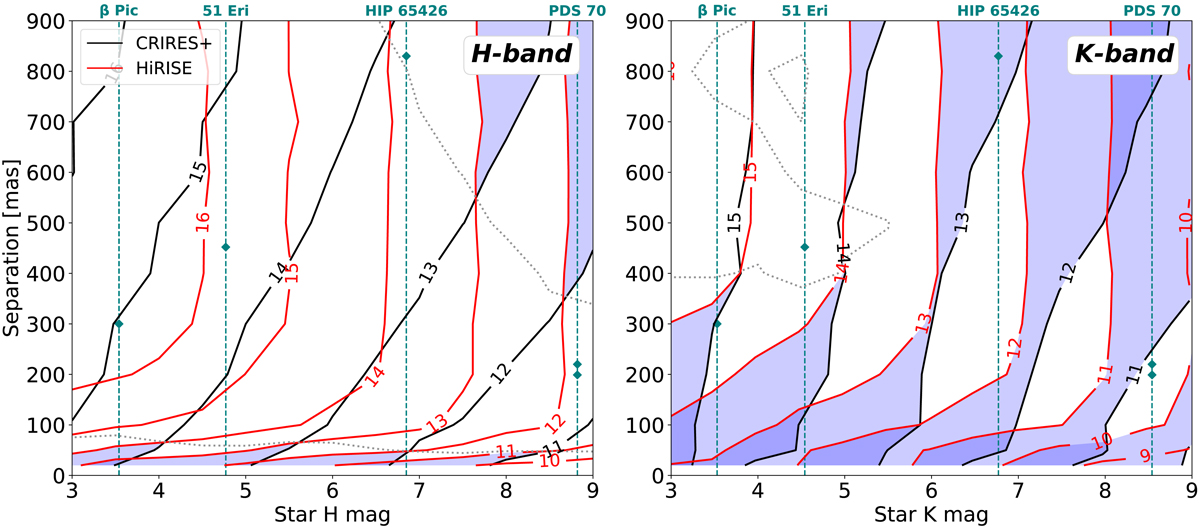
Contours showing the contrast (Δm) where an S/N of 5 is reached as a function of H (left) and K (right) magnitudes of the host star and separation of a 1200 K planet in 2 h of observing time. The black and red contours show the limits for CRIRES+ and HiRISE without coronagraph, respectively. The gray dotted contour shows where HiRISE and CRIRES+ have equal performance, and the blue shaded regions indicate where CRIRES+ outperforms HiRISE for the provided contour lines. The magnitudes of known planet hosting stars are indicated with vertical green dashed lines, and the separations of their known companions with diamond markers.
Current usage metrics show cumulative count of Article Views (full-text article views including HTML views, PDF and ePub downloads, according to the available data) and Abstracts Views on Vision4Press platform.
Data correspond to usage on the plateform after 2015. The current usage metrics is available 48-96 hours after online publication and is updated daily on week days.
Initial download of the metrics may take a while.