Open Access
Fig. 7.
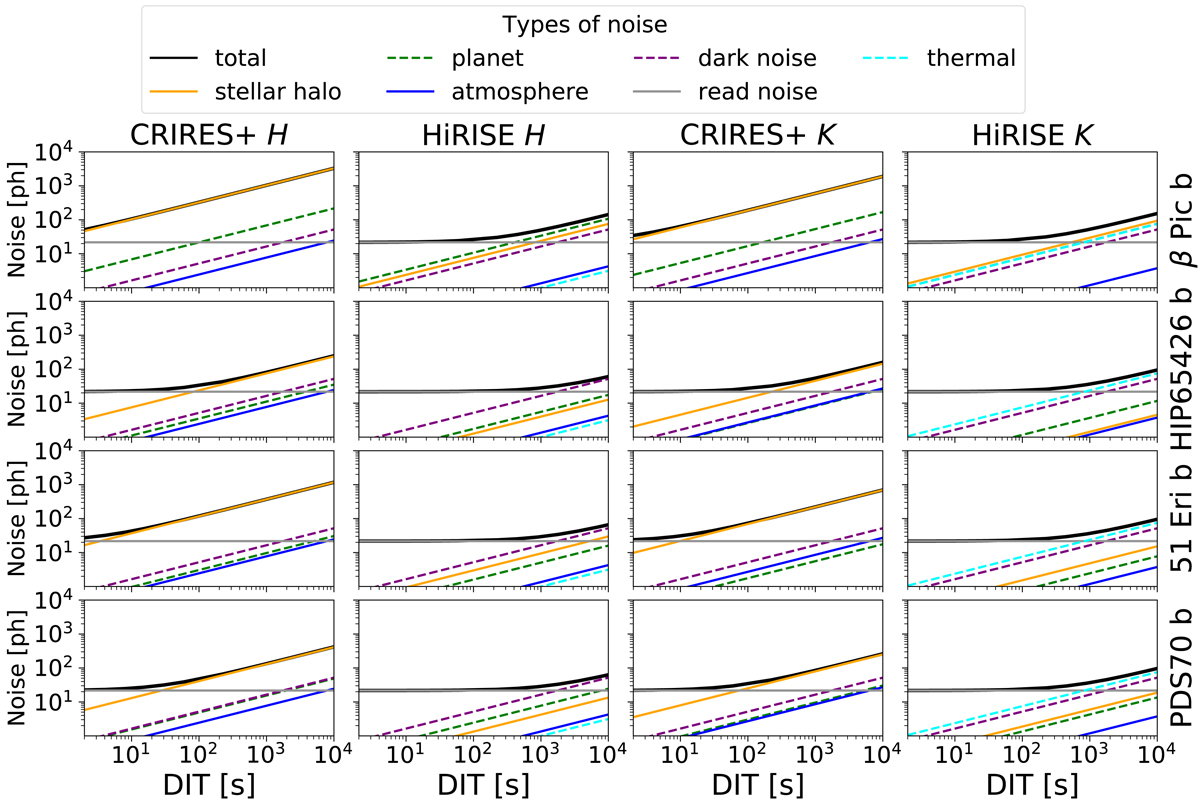
Breakdown of the noise into individual sources vs. detector integration time for four planets observed using CRIRES+ and HiRISE without coronagraph. The noise is effectively the average noise per resolution element within a certain band and is expressed in photons.
Current usage metrics show cumulative count of Article Views (full-text article views including HTML views, PDF and ePub downloads, according to the available data) and Abstracts Views on Vision4Press platform.
Data correspond to usage on the plateform after 2015. The current usage metrics is available 48-96 hours after online publication and is updated daily on week days.
Initial download of the metrics may take a while.