Fig. C.2.
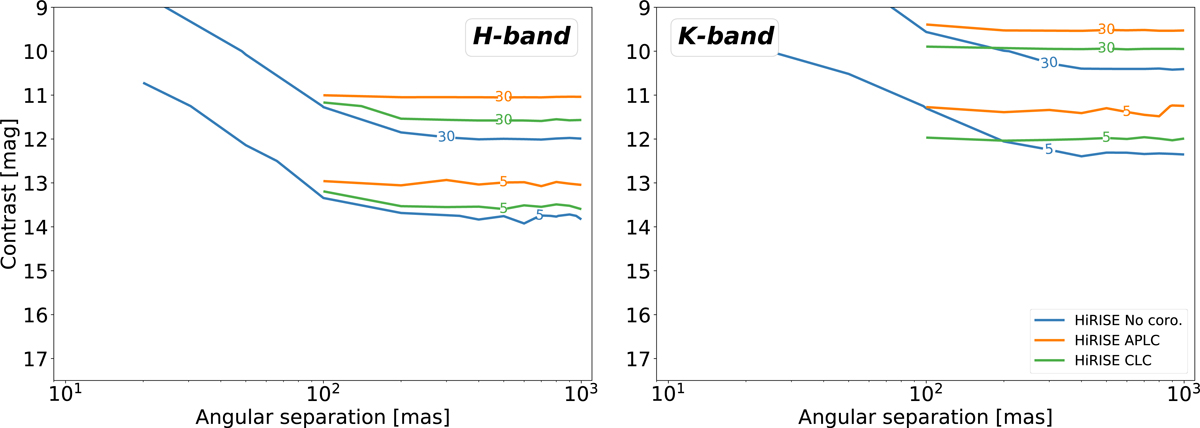
Signal-to-noise ratio as a function of contrast (Δm) and log-scaled separation for HiRISE without a coronagraph (blue lines), with an APLC (orange lines), and with a CLC (green lines). The simulation is performed for a HIP 65426-like host star with a 1200 K planet and 2 h of integration time. S/N values below the inner working angle radius of 92.5 mas have been suppressed for the two modes using the focal plane mask. The S/N is computed with a matched filtering approach (see Sect. 3.1) comparing the simulated spectra with the noiseless input planet spectrum. The known planet HIP 65246 b is indicated by a blue box.
Current usage metrics show cumulative count of Article Views (full-text article views including HTML views, PDF and ePub downloads, according to the available data) and Abstracts Views on Vision4Press platform.
Data correspond to usage on the plateform after 2015. The current usage metrics is available 48-96 hours after online publication and is updated daily on week days.
Initial download of the metrics may take a while.