Fig. 8
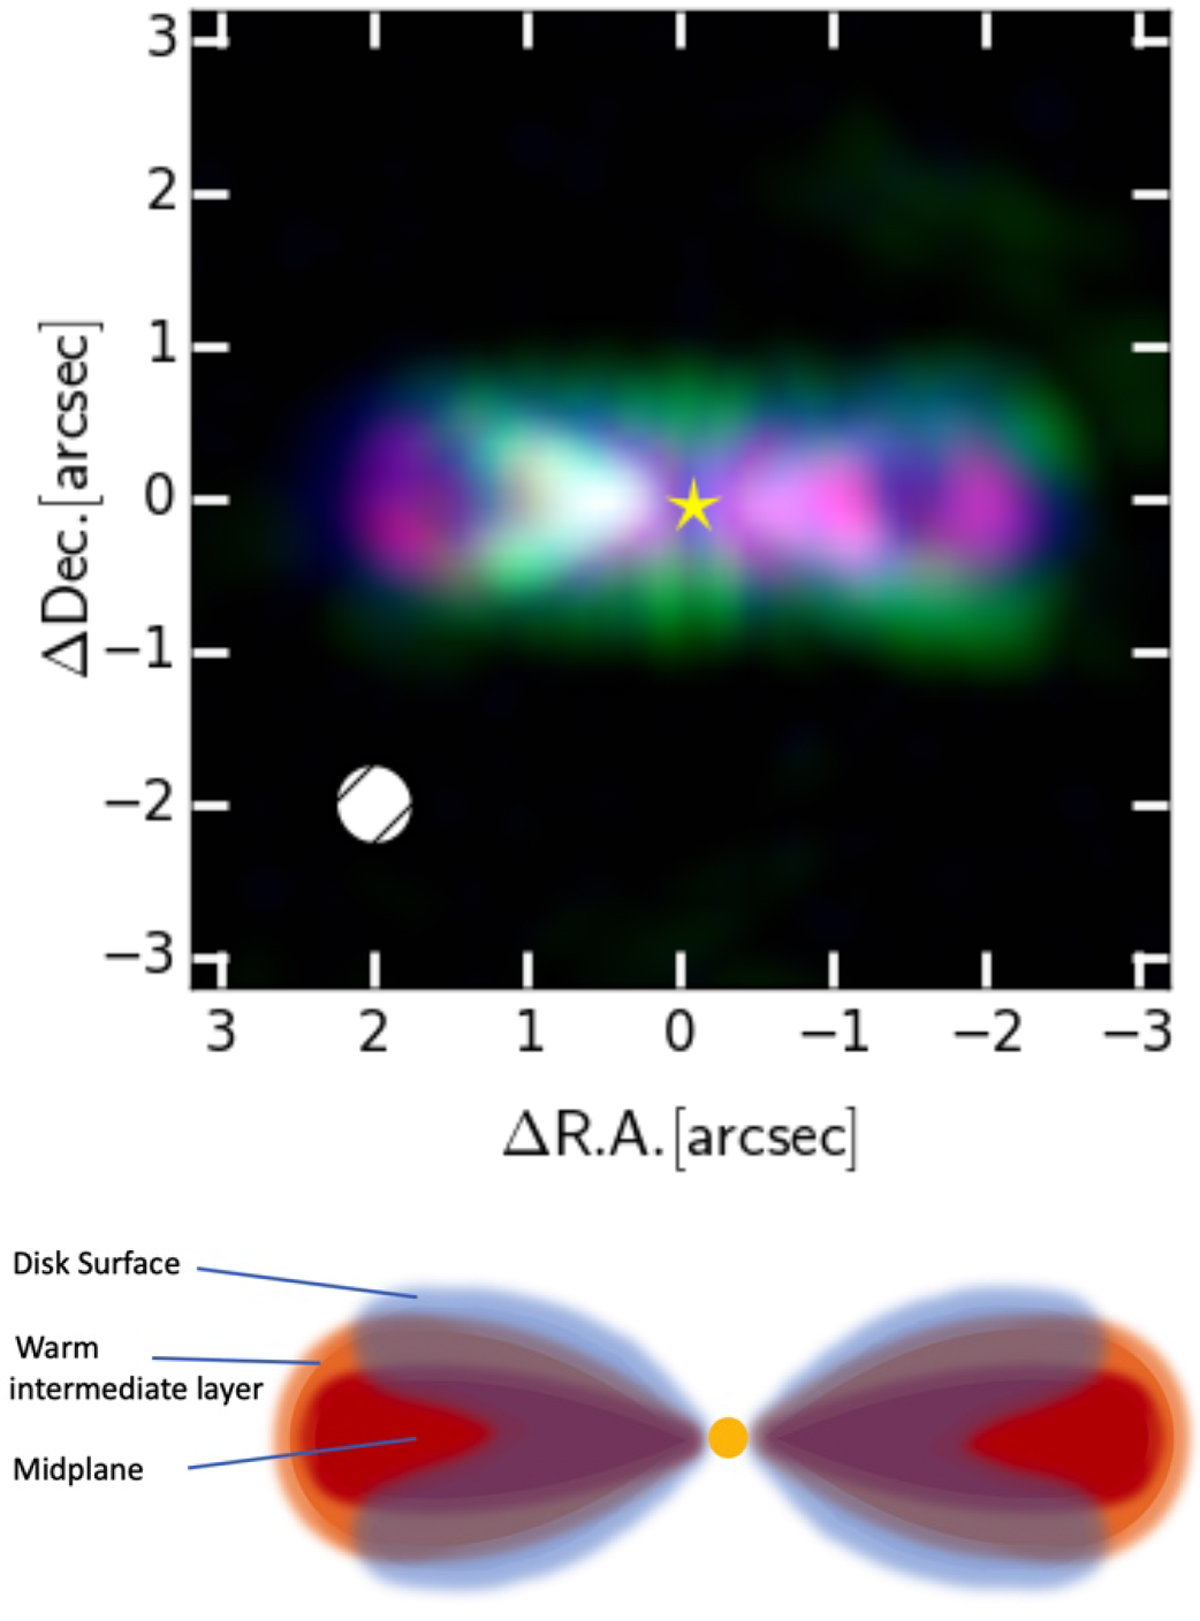
Comparison of CS, CN, and CO emission using peak intensity (CASA moment 8) maps. Top: RGB image generated from CS, CN, and CO peak intensity maps. CS, CN, and CO are assigned to the red, green, and blue channels, respectively; each color channel is scaled linearly. Bottom: schematic illustration of the different layers traced by CS (midplane), CN (midplane to intermediate layers), and CO (upper disk surface) emission.
Current usage metrics show cumulative count of Article Views (full-text article views including HTML views, PDF and ePub downloads, according to the available data) and Abstracts Views on Vision4Press platform.
Data correspond to usage on the plateform after 2015. The current usage metrics is available 48-96 hours after online publication and is updated daily on week days.
Initial download of the metrics may take a while.