Fig. 7
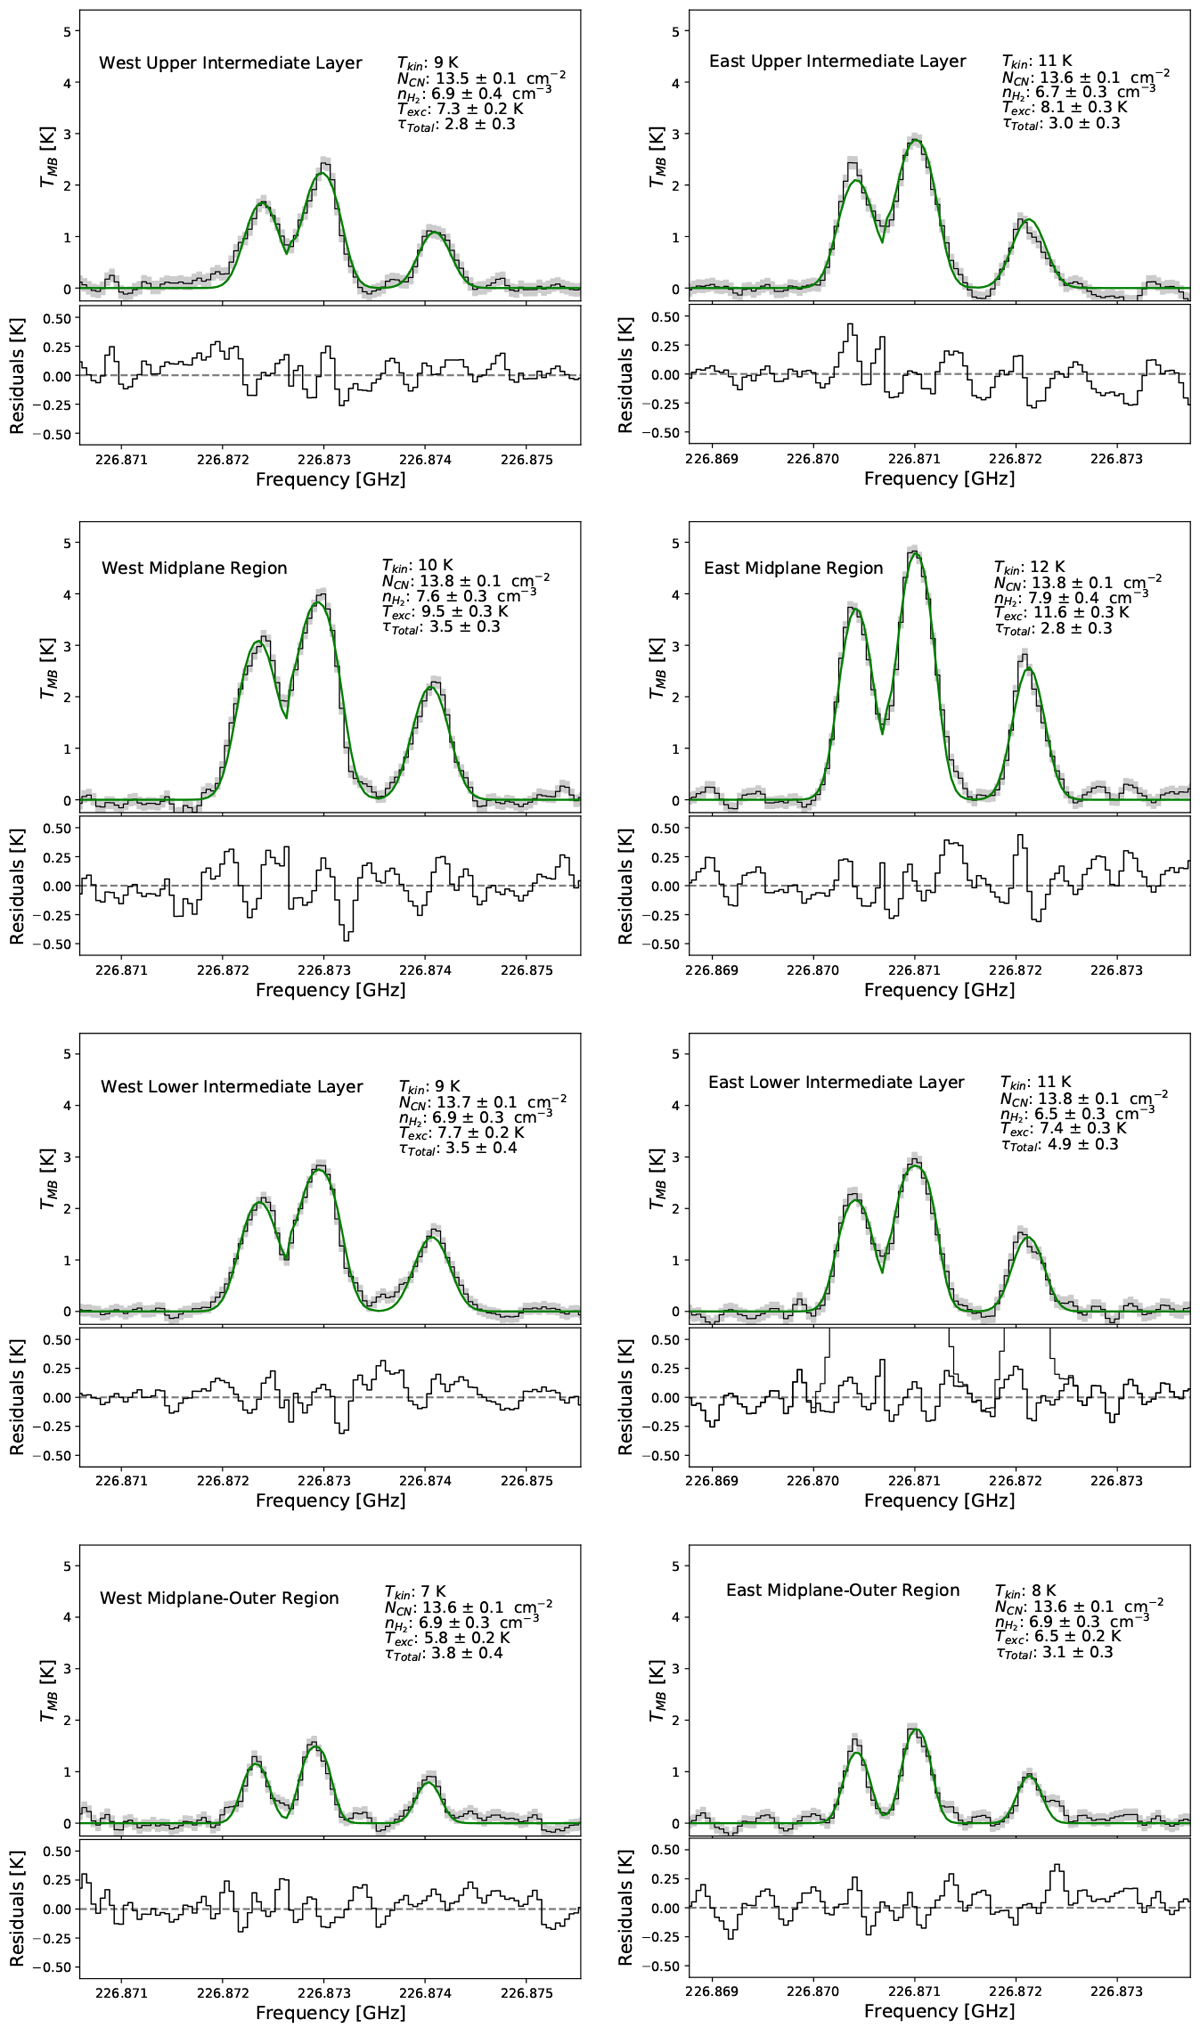
Spectra of the integrated CN (2–1) emission from the upper intermediate layers, lower intermediate layers, midplane, and outer midplane regions of the disk along with the simultaneous fits to components A, B, and C (see Table 3). The best-fit LVG models from the χ2 minimization are displayed as a green line. The fitted parameters are the total optical depth (τ; A+B+C), excitation temperature (Tex), and, on a logarithmic scale, CN column density (NCN) and particle density (![]() ; see Table 4). Spectra in the left and right columns are extracted from the western and eastern sides of the disk, respectively. The fit residuals are shown as a function of frequency at the bottom of each panel. The shaded gray area shows the error computed from a signal-free part of the spectra.
; see Table 4). Spectra in the left and right columns are extracted from the western and eastern sides of the disk, respectively. The fit residuals are shown as a function of frequency at the bottom of each panel. The shaded gray area shows the error computed from a signal-free part of the spectra.
Current usage metrics show cumulative count of Article Views (full-text article views including HTML views, PDF and ePub downloads, according to the available data) and Abstracts Views on Vision4Press platform.
Data correspond to usage on the plateform after 2015. The current usage metrics is available 48-96 hours after online publication and is updated daily on week days.
Initial download of the metrics may take a while.