Fig. 6
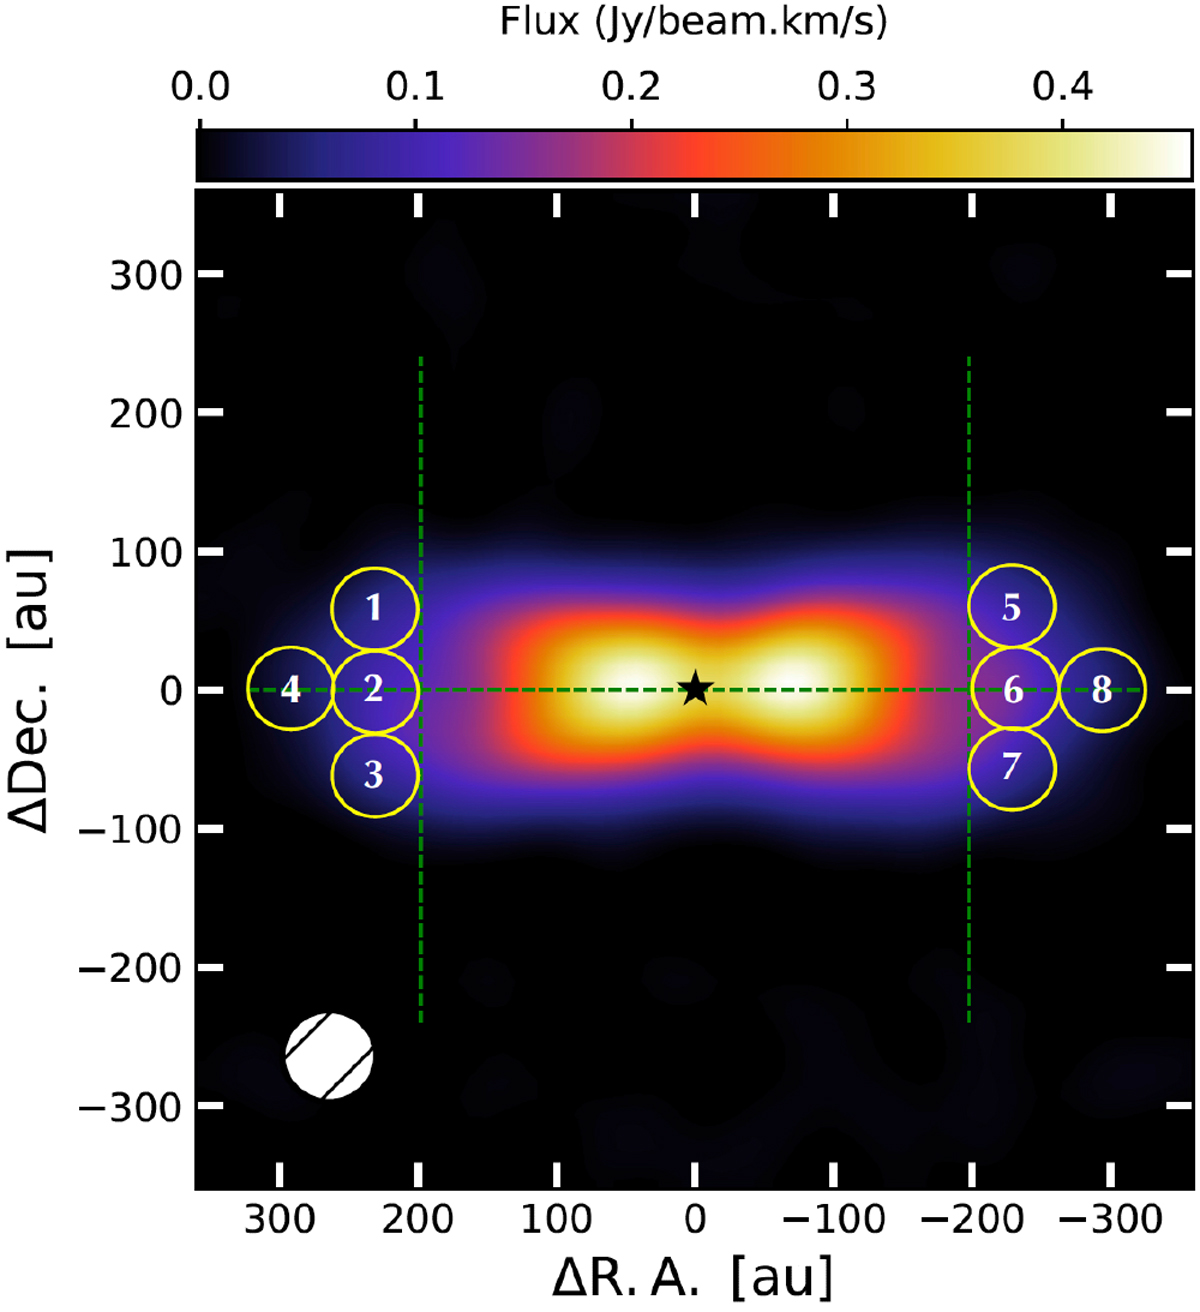
Integrated intensity map of the CN emission overlaid with eight enumerated circles representing the eight single-beamwidth (0.3′′ radius) regions from which we extract spectra at each side of the disk at radii > 210 au (see Table 4, Sect. 3.3, and Fig. 7). The synthesizedbeam size is indicated by the white ellipse. Vertical dashed green lines are placed at radii of ~210 au from the central star; the horizontal dashed green line indicates the disk midplane.
Current usage metrics show cumulative count of Article Views (full-text article views including HTML views, PDF and ePub downloads, according to the available data) and Abstracts Views on Vision4Press platform.
Data correspond to usage on the plateform after 2015. The current usage metrics is available 48-96 hours after online publication and is updated daily on week days.
Initial download of the metrics may take a while.