Fig. 5
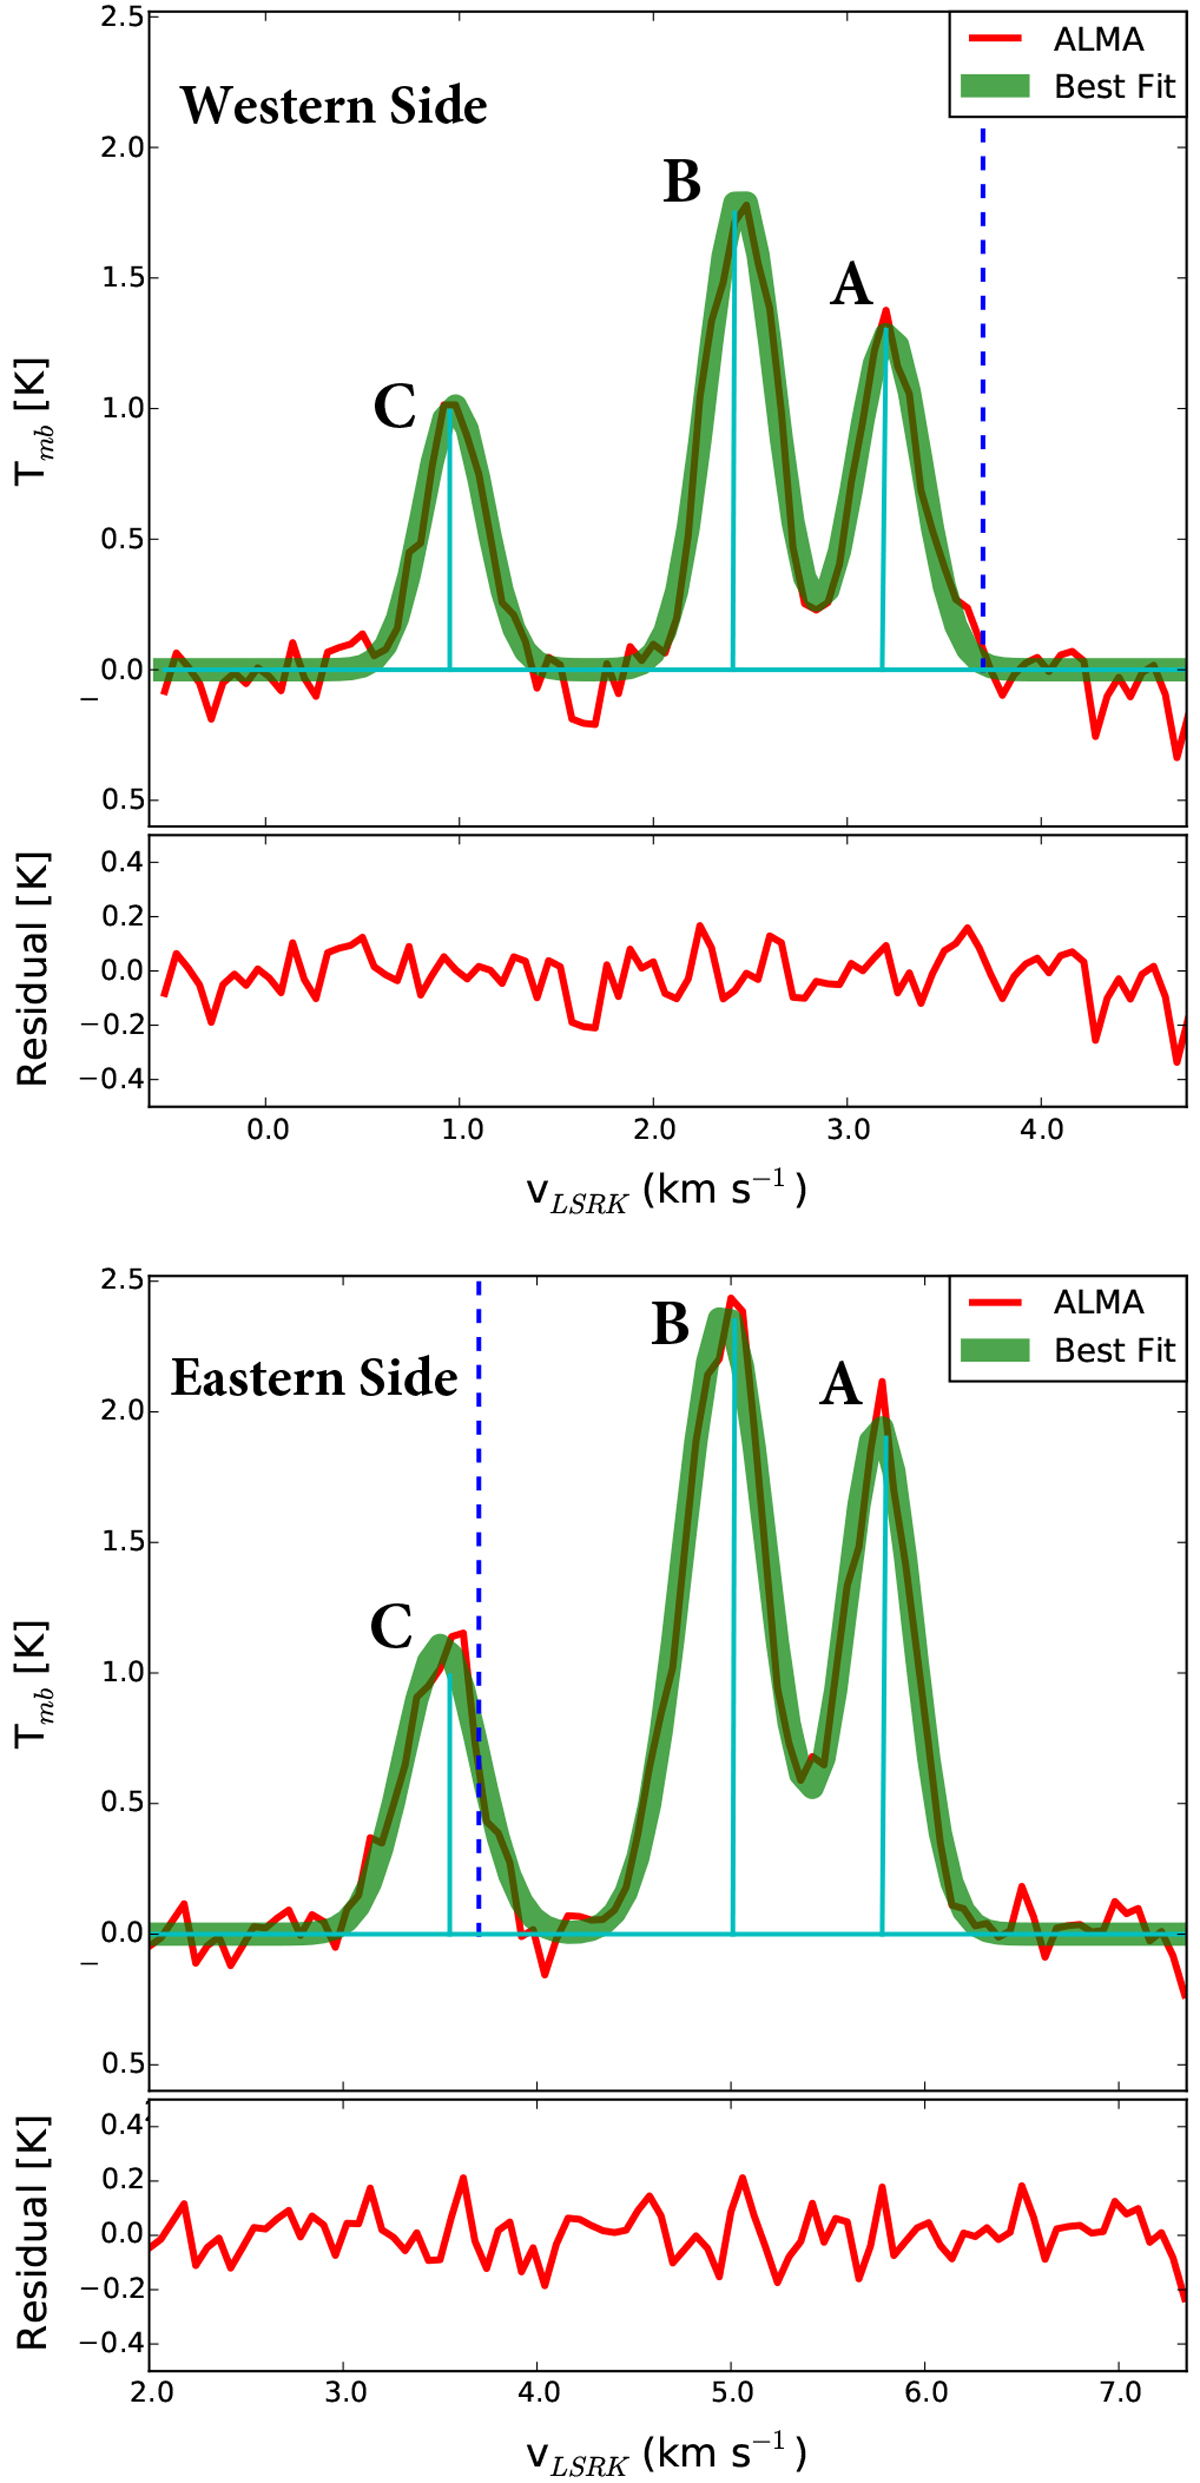
Observed CN spectra (red), extracted from the outer region of the disk (>210 au), with the Gaussian fits (green). Top and bottom panels: HF structure extracted from the western and eastern sides of the disk, respectively. Cyan lines in the observed spectra mark the brightest HF components and have been scaled to match the peak intensity in the B component of the observed spectrum. The dashed blue line represents the systemic velocity of the system (~3.7 km s−1). These data can be converted to Jy km s−1 by using the unit conversion factor of ~55 K.
Current usage metrics show cumulative count of Article Views (full-text article views including HTML views, PDF and ePub downloads, according to the available data) and Abstracts Views on Vision4Press platform.
Data correspond to usage on the plateform after 2015. The current usage metrics is available 48-96 hours after online publication and is updated daily on week days.
Initial download of the metrics may take a while.