Fig. 4
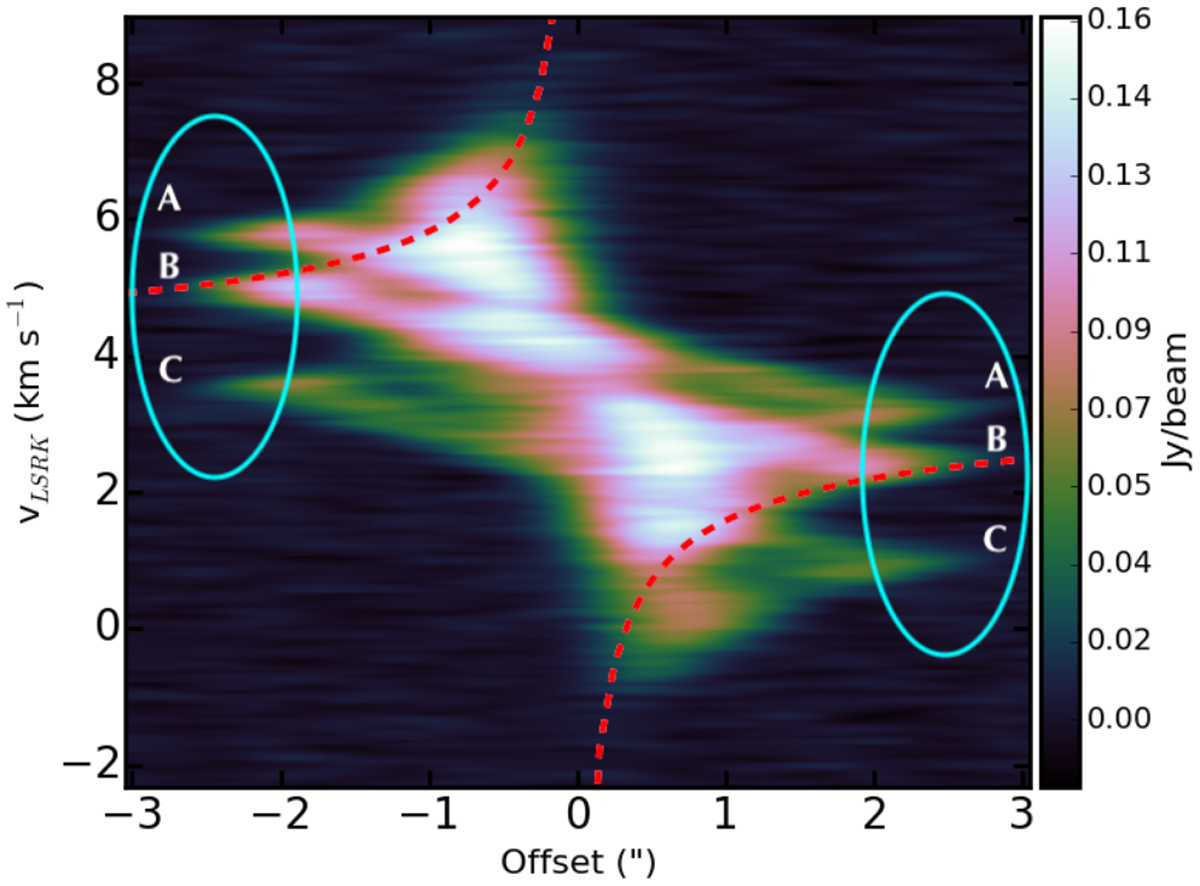
Position-velocity diagram along the disk major axis of the CN emission. The dashed curve is a Keplerian velocity profile for a stellar mass of 0.61 M⊙ at an inclination of 87° and a systemic velocity of 3.70 km s−1 LSRK. The VLSRK scale is with respect to the brightest HF component (B) detected at frequency 226.8747813 GHz. Labels A, B, and C indicate the brightest HF transitions (see Table 1). Cyan ellipses correspond to the regions from which we extracted the spectra analyzed in Sect. 3.2.2.
Current usage metrics show cumulative count of Article Views (full-text article views including HTML views, PDF and ePub downloads, according to the available data) and Abstracts Views on Vision4Press platform.
Data correspond to usage on the plateform after 2015. The current usage metrics is available 48-96 hours after online publication and is updated daily on week days.
Initial download of the metrics may take a while.