Fig. 1
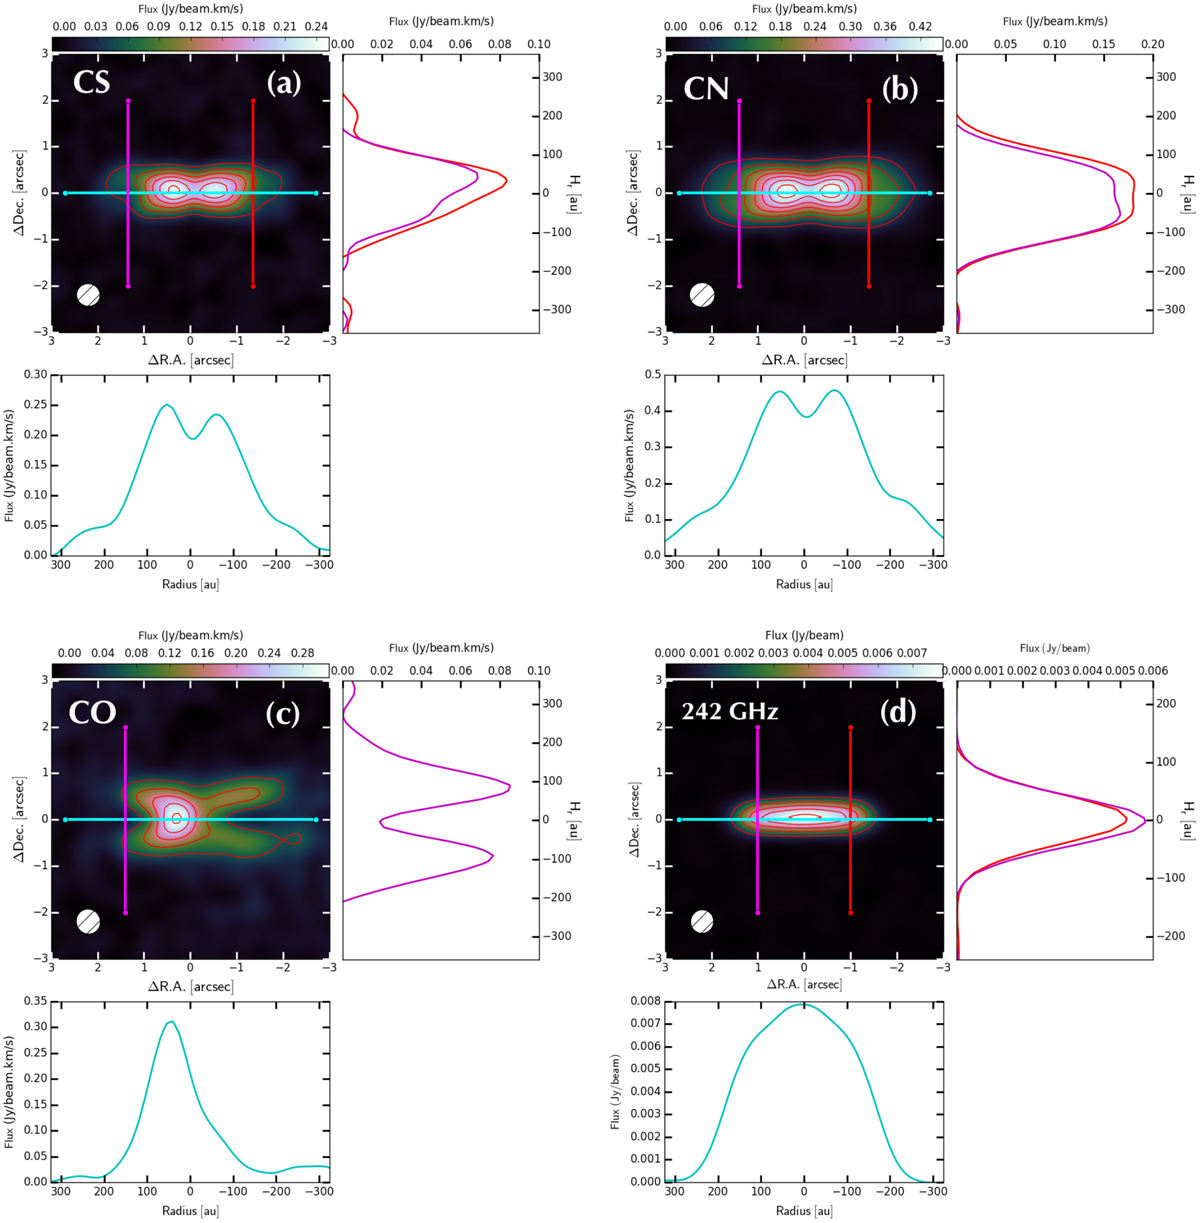
Integrated emission and dust continuum images at 242 GHz of the nearly edge-on Flying Saucer disk. Panel a: integrated emission map of CS from −0.9 to 8.6 km s−1 with contours showing 10, 20, 30, 40, 50, and 60σ emission (σ = 55 mJy beam−1 km s−1); the 0.53′′ × 0.51′′ at PA −57.8° beam is indicated in the bottom left corner. Panel b: integrated emission map of CN from 0.8 to 10.4 km s−1 with contours showing 10, 20, 30, 40, 50, 60, 70, and 80 σ emission (σ = 60 mJy beam−1 km s−1) and a 0.57′′ × 0.55′′ at PA −55.0° beam.Panel c: integrated emission map of CO from −0.9 to 8.6 km s−1 with contours showing 10, 20, 30, and 40σ emission (σ = 90 mJy beam−1 km s−1) and a 0.56′′ × 0.54′′ at PA −63.4° beam. Panel d: ALMA 1.236 mm dust continuum image (natural weighting) with a 0.64′′ × 0.60′′ at PA −56° beam. At the bottom of each panel, the radial intensity profiles of the integrated CS, CN, and CO emissions and 242 GHz continuum are shown. The radial profiles are extracted along a cut through the disk midplane (PA = 3°) and displayed by cyan lines in each image. Similarly, to the right of each panel, the representative vertical intensity profiles of the integrated CS, CN, and CO emissions are shown. The vertical profiles are extracted along a cut at a radius of 170 au for CS, CN, and CO, and at 120 au for the 242 GHz continuum. (See Sect. 3.1.)
Current usage metrics show cumulative count of Article Views (full-text article views including HTML views, PDF and ePub downloads, according to the available data) and Abstracts Views on Vision4Press platform.
Data correspond to usage on the plateform after 2015. The current usage metrics is available 48-96 hours after online publication and is updated daily on week days.
Initial download of the metrics may take a while.