Fig. 7.
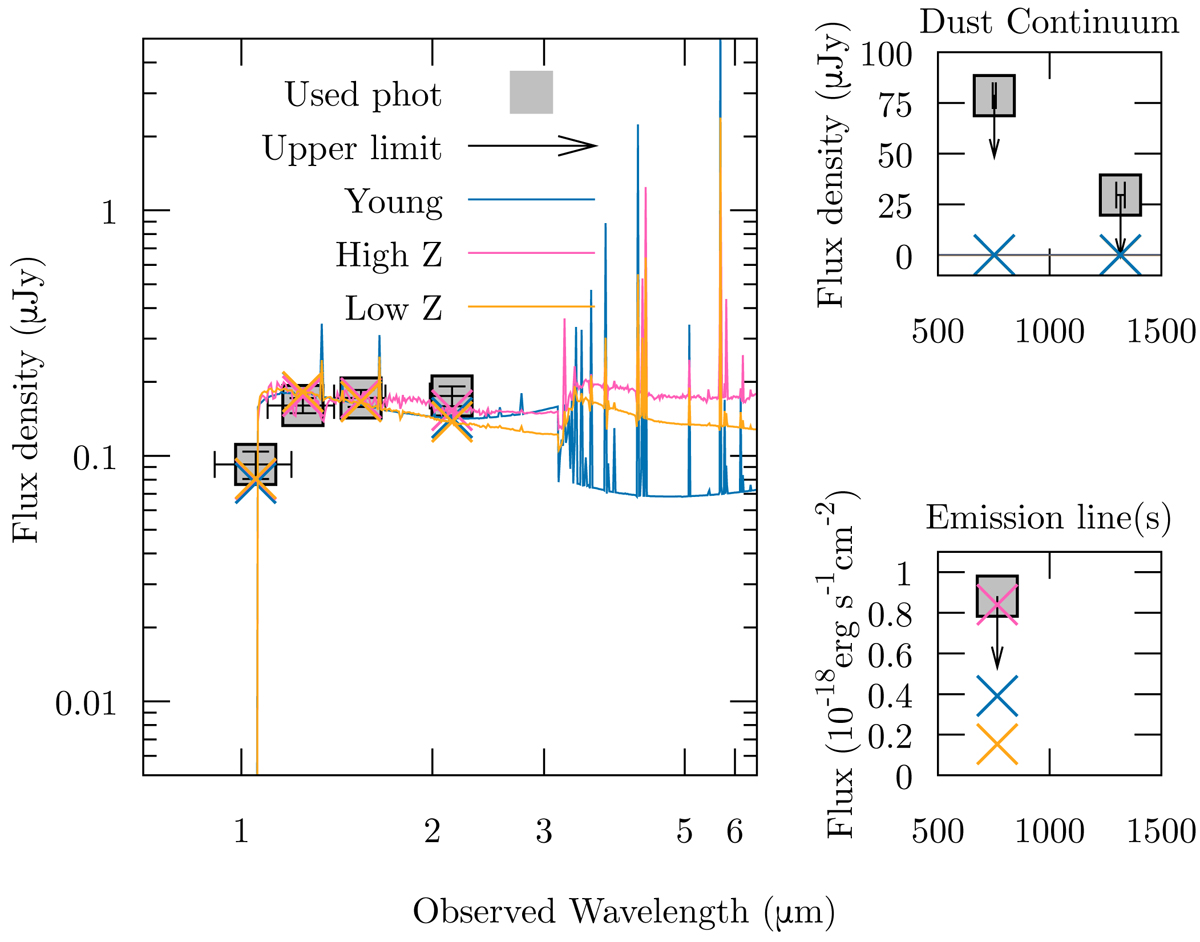
PANHIT SEDs of three selected models with ages < 0.3 Gyr (see text). The yellow line shows an old (0.29 Gyr), low-metallicity (Z = 0.0004) model (Low Z), the pink line shows a model with the same age but high metallicity (Z = 0.02 ; High Z) and the blue line shows a young, low-metallicity model (Young; Age = 2 Myr, Z = 0.0001). The main panel shows the spectrum in the rest-frame UV and optical, with upper limits and measured photometry from HST and VLT/HAWK-I. The small panels show our ALMA upper limits on the dust continuum (top panel) and the [O III] emission line (bottom panel). Upper limits are at the 3σ level and are indicated with arrows. We note that the dust-continuum fluxes of the three models (crosses) overlap in the top panel.
Current usage metrics show cumulative count of Article Views (full-text article views including HTML views, PDF and ePub downloads, according to the available data) and Abstracts Views on Vision4Press platform.
Data correspond to usage on the plateform after 2015. The current usage metrics is available 48-96 hours after online publication and is updated daily on week days.
Initial download of the metrics may take a while.