Fig. 6.
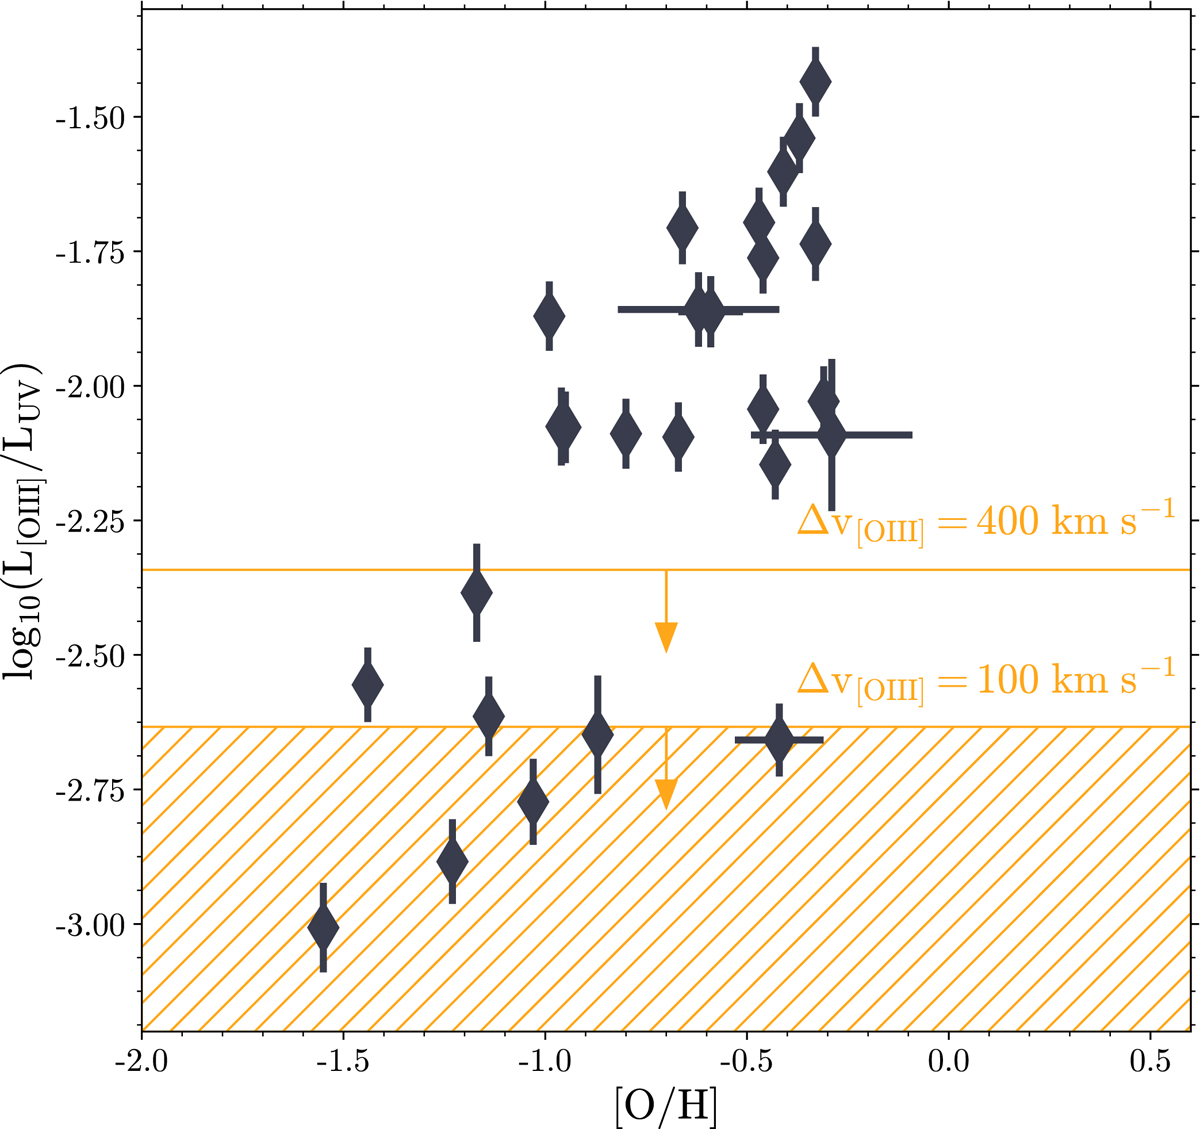
[O III] to UV luminosity ratio (LO III/LUV) plotted against the oxygen abundance relative to the sun ([O/H] = log10(nO/nH)−log10(nO/nH)⊙). The hatched area shows the upper limit on z7_GSD_3811 based on our 3σ upper limit on the [O III] assuming a line-width of 100 km s−1, while the yellow line shows the corresponding value if we assume a four times wider line. The dark gray diamonds show local dwarf galaxies from Madden et al. (2013), De Looze et al. (2014), and Cormier et al. (2015) compiled by Inoue et al. (2016).
Current usage metrics show cumulative count of Article Views (full-text article views including HTML views, PDF and ePub downloads, according to the available data) and Abstracts Views on Vision4Press platform.
Data correspond to usage on the plateform after 2015. The current usage metrics is available 48-96 hours after online publication and is updated daily on week days.
Initial download of the metrics may take a while.