Fig. 5.
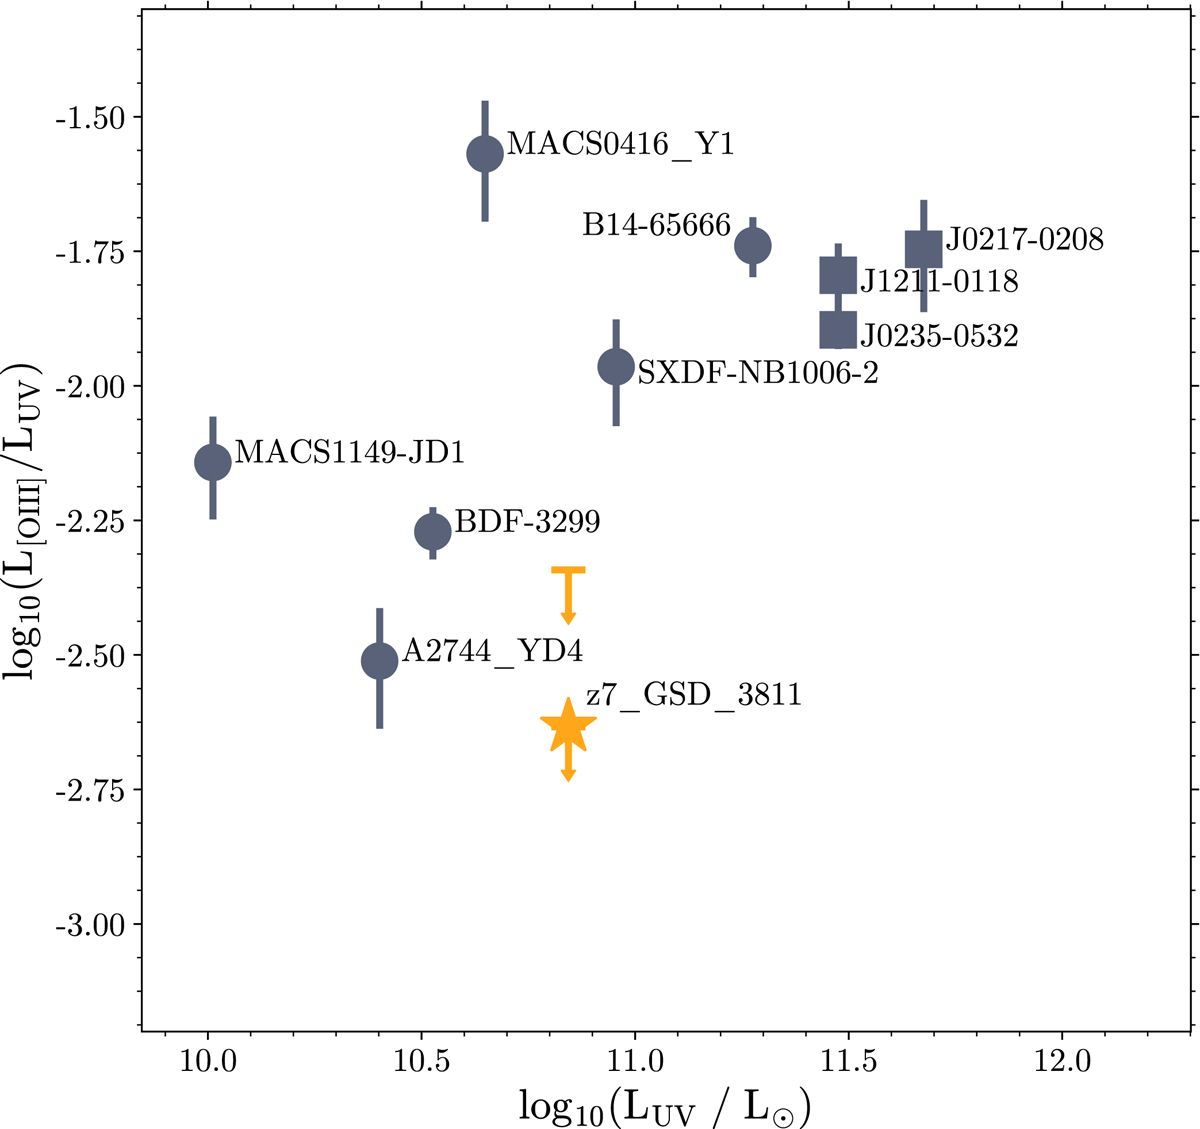
[O III] to UV luminosity ratio shown as a function of the UV luminosity. The yellow star shows the upper limit on the [O III] luminosity in z7_GSD_3811 assuming a line-width of 100 km s−1, while the dash and arrow show the corresponding upper limit assuming a line-width of 400 km s−1. The gray circles show [O III]-detected objects at z > 7 (Inoue et al. 2016; Laporte et al. 2017; Carniani et al. 2017; Hashimoto et al. 2018, 2019a; Tamura et al. 2019; Harikane et al. 2020), while squares show the three recent detections by Harikane et al. (2020) at z ∼ 6. The UV luminosity has been calculated with lensing considered, however, the errors in the lensing magnification are not included in this figure.
Current usage metrics show cumulative count of Article Views (full-text article views including HTML views, PDF and ePub downloads, according to the available data) and Abstracts Views on Vision4Press platform.
Data correspond to usage on the plateform after 2015. The current usage metrics is available 48-96 hours after online publication and is updated daily on week days.
Initial download of the metrics may take a while.