Fig. 1.
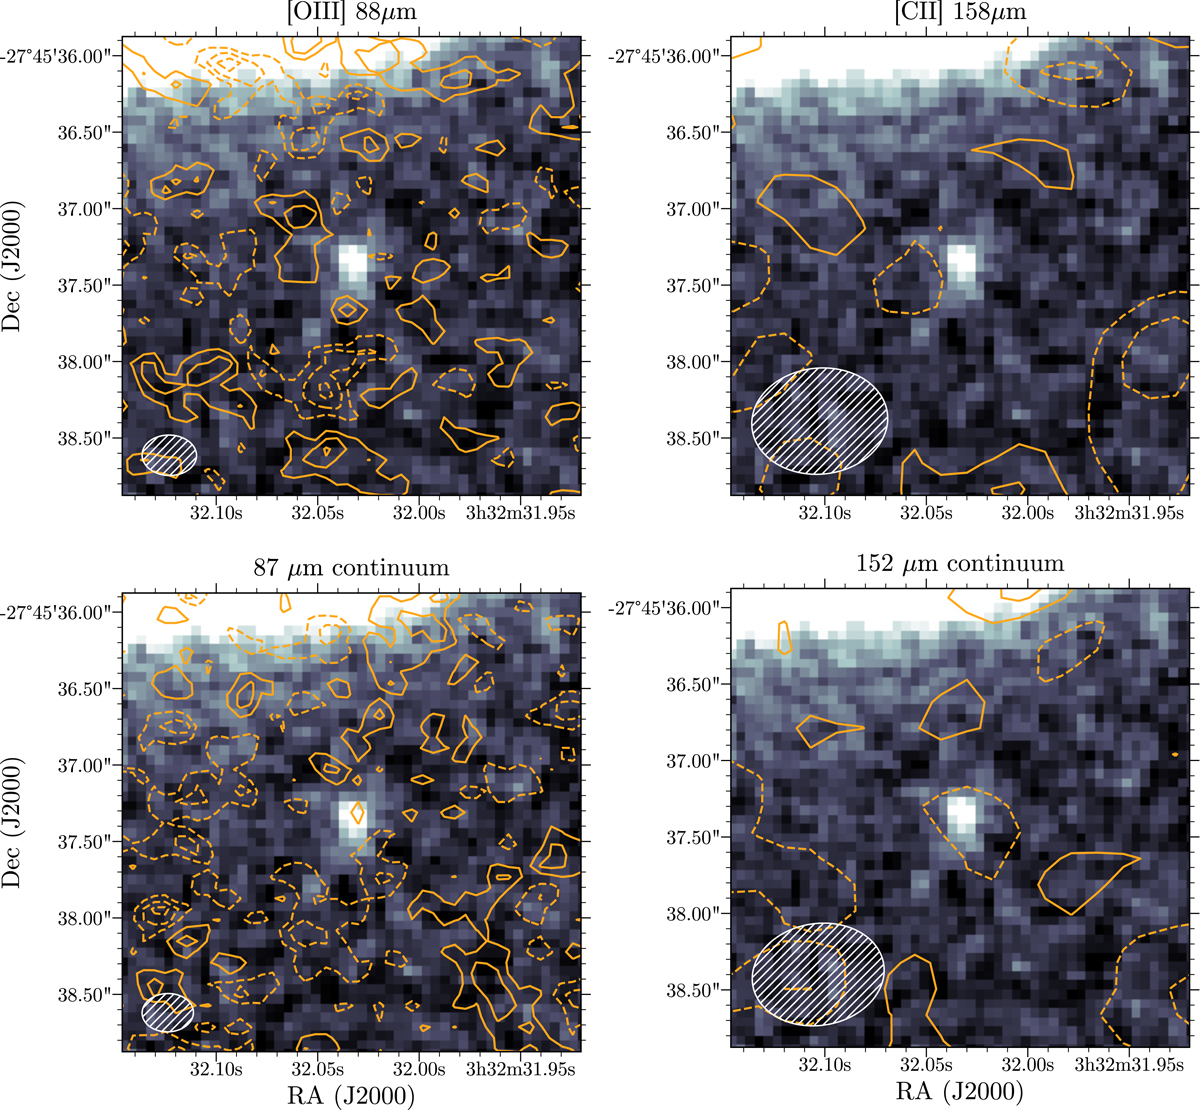
ALMA observations drawn at (− 3, −2, −1, 1, 2, 3) × σ overlaid on the HST F160W image of z7_GSD_3811. The positive and negative contours are drawn with solid and dashed lines, respectively. The white hatched ellipse in the bottom of each frame shows the synthesized beam of ALMA. Top left: [O III] line contours for an image collapsed over 400 km s−1 around 391.63 GHz, where σ = 44 mJy km s−1 beam−1. Top right: [C II] line contours for an image collapsed over 400 km s−1 around 219.37 GHz, where σ = 19 mJy km s−1 beam−1. Bottom left: dust continuum contours at 87 μm, where σ = 26 μJy beam−1. Bottom right: dust continuum contours at 152 μm, where σ = 9.9 μJy beam−1.
Current usage metrics show cumulative count of Article Views (full-text article views including HTML views, PDF and ePub downloads, according to the available data) and Abstracts Views on Vision4Press platform.
Data correspond to usage on the plateform after 2015. The current usage metrics is available 48-96 hours after online publication and is updated daily on week days.
Initial download of the metrics may take a while.