Open Access
Fig. 5.
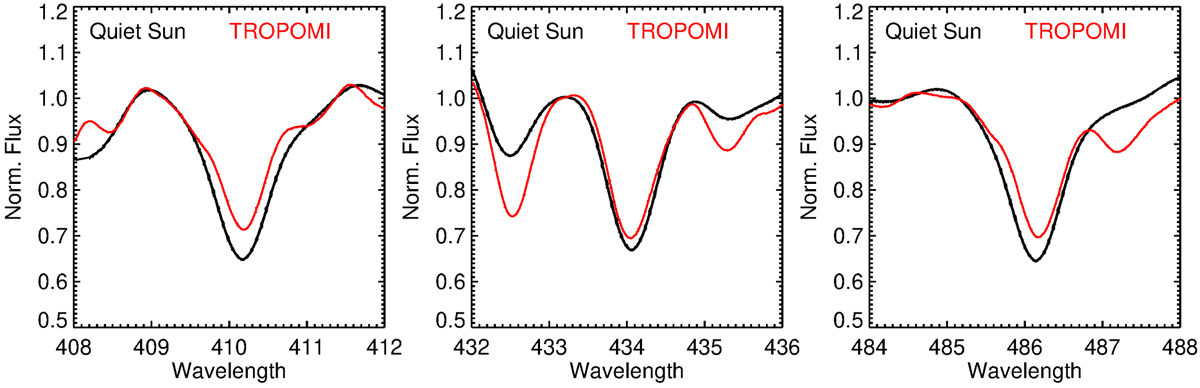
Quiet Sun model profiles shown in black, and the TROPOMI observations from March 27, 2019, followed by red lines. Both the observations and the models are normalized by the average fluxes sampled at the short-wavelength line flanks (Table 1).
Current usage metrics show cumulative count of Article Views (full-text article views including HTML views, PDF and ePub downloads, according to the available data) and Abstracts Views on Vision4Press platform.
Data correspond to usage on the plateform after 2015. The current usage metrics is available 48-96 hours after online publication and is updated daily on week days.
Initial download of the metrics may take a while.