Fig. 1.
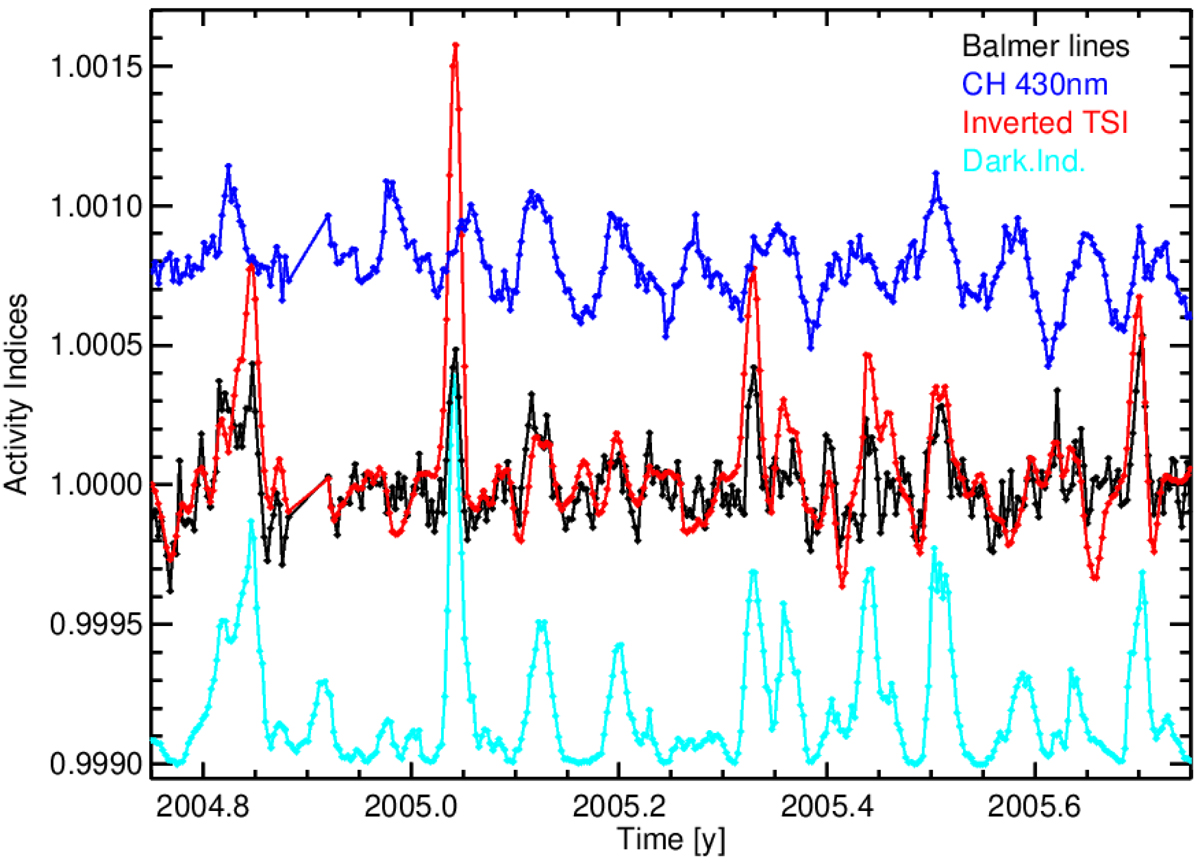
Average de-trended Balmer activity indices derived from the near-daily OMI observations (black line) normalized to a minimum activity level and compared with the normalized and inverted TSI (red line), showing a clear correlation between the Balmer-line and TSI variability. For a reference, the OMI CH430nm activity indices (blue line) are normalized, downscaled, and shifted for clarity. The cyan line follows the NRLSSI2 sunspot darkening factors (Coddington et al. 2016), which are scaled and shifted for the sake of clarity. The Balmer line activity indices shown carry 7.8 * 10−5 1-σ uncertainties.
Current usage metrics show cumulative count of Article Views (full-text article views including HTML views, PDF and ePub downloads, according to the available data) and Abstracts Views on Vision4Press platform.
Data correspond to usage on the plateform after 2015. The current usage metrics is available 48-96 hours after online publication and is updated daily on week days.
Initial download of the metrics may take a while.