Fig. 4.
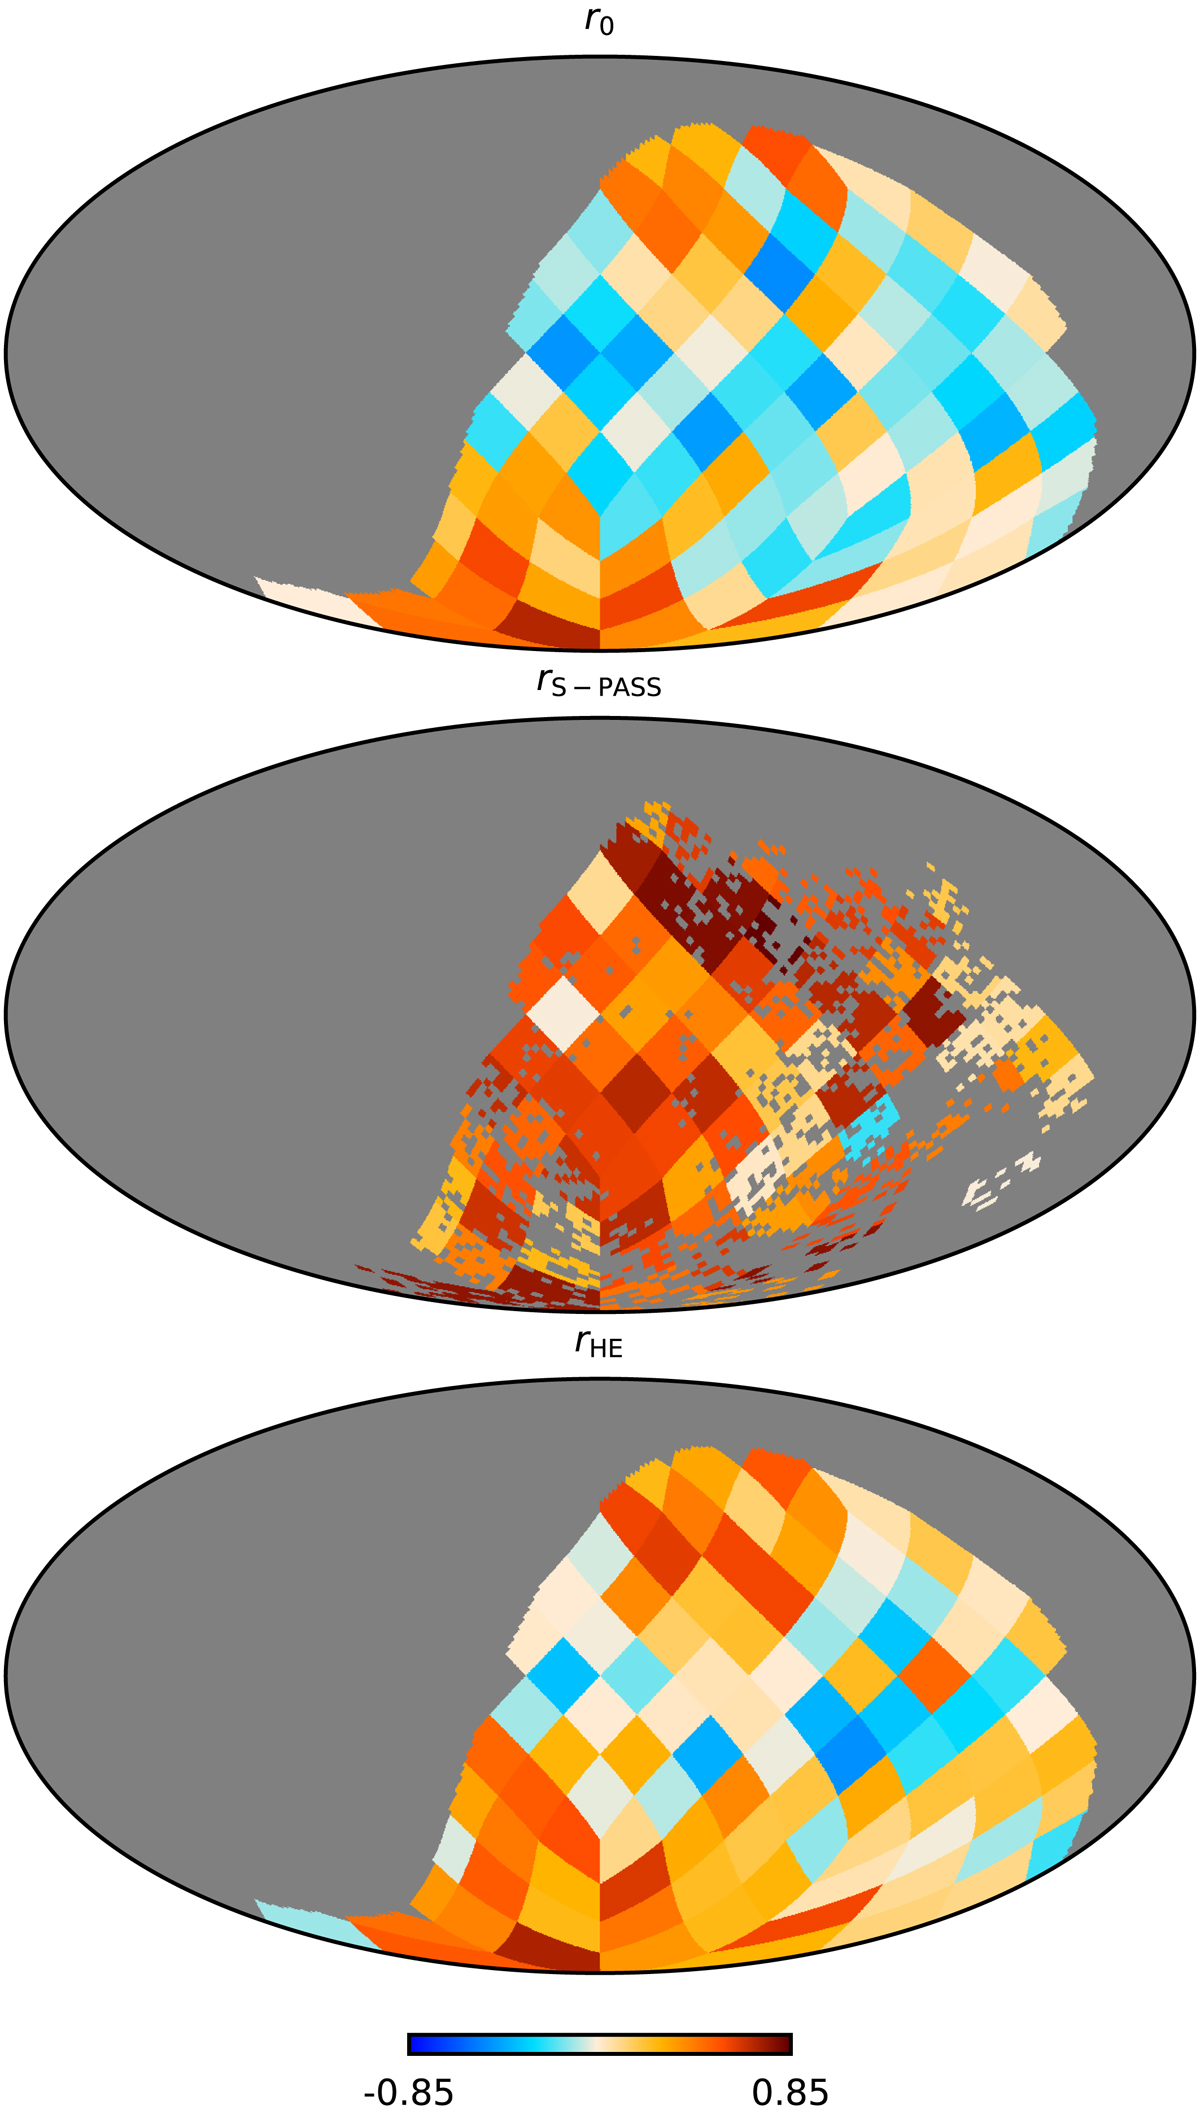
Pearson correlation coefficient, r, evaluated between S-PASS data and WMAP data in regions spanning 15° ×15°. The WMAP data are the same in all panels, while the S-PASS data are, from top to bottom, (1) uncorrected data RM-0; (2) Faraday-corrected using RM-SPASS map (Carretti et al. 2019); and (3) Faraday-corrected using RM-HE (Hutschenreuter & Enßlin 2020).
Current usage metrics show cumulative count of Article Views (full-text article views including HTML views, PDF and ePub downloads, according to the available data) and Abstracts Views on Vision4Press platform.
Data correspond to usage on the plateform after 2015. The current usage metrics is available 48-96 hours after online publication and is updated daily on week days.
Initial download of the metrics may take a while.