Fig. 15.
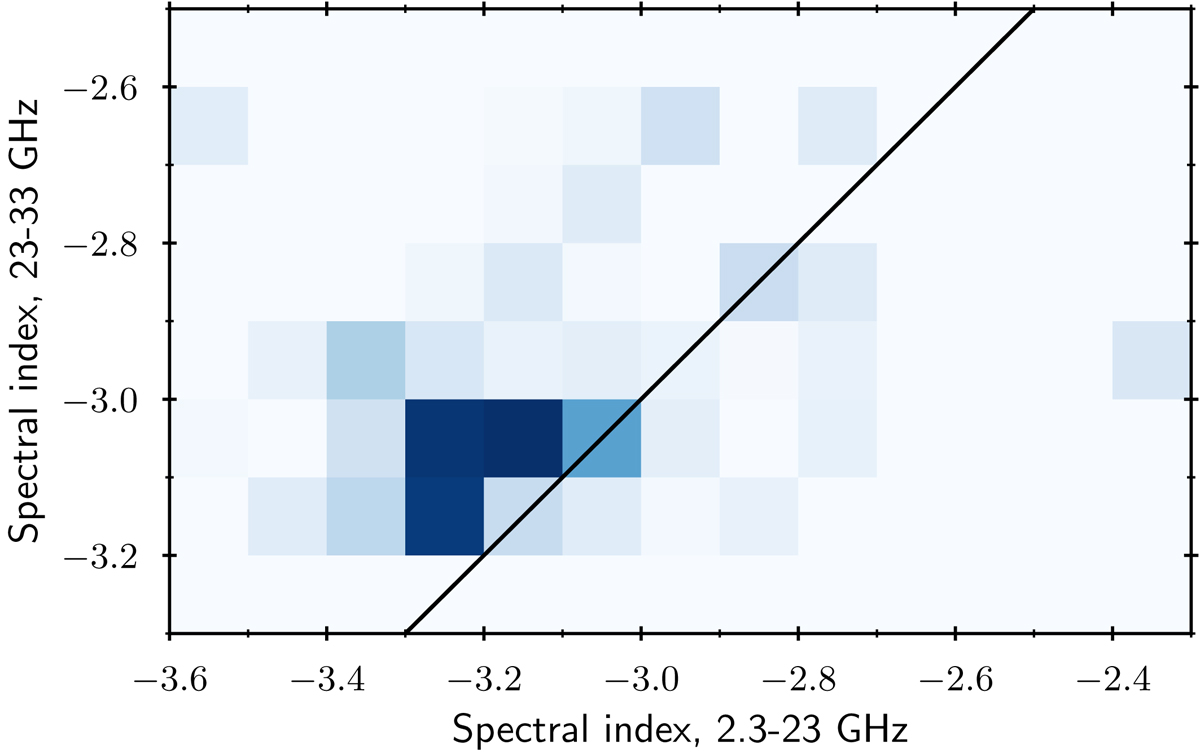
2D histogram of the polarized synchrotron spectral indices from Fuskeland et al. (2014) (y-axis) versus the final results in this paper (x-axis). The set of pixels that are common to both studies are the final S-PASS pixels minus pixels around a few bright compact objects. The line y = x is shown. The figure indicates a flattening of about Δβs ∼ 0.1 from low to higher frequencies. The histogram column with the darkest blue color corresponds to about 1500 pixels of the total 10 830 pixels.
Current usage metrics show cumulative count of Article Views (full-text article views including HTML views, PDF and ePub downloads, according to the available data) and Abstracts Views on Vision4Press platform.
Data correspond to usage on the plateform after 2015. The current usage metrics is available 48-96 hours after online publication and is updated daily on week days.
Initial download of the metrics may take a while.