Fig. 12.
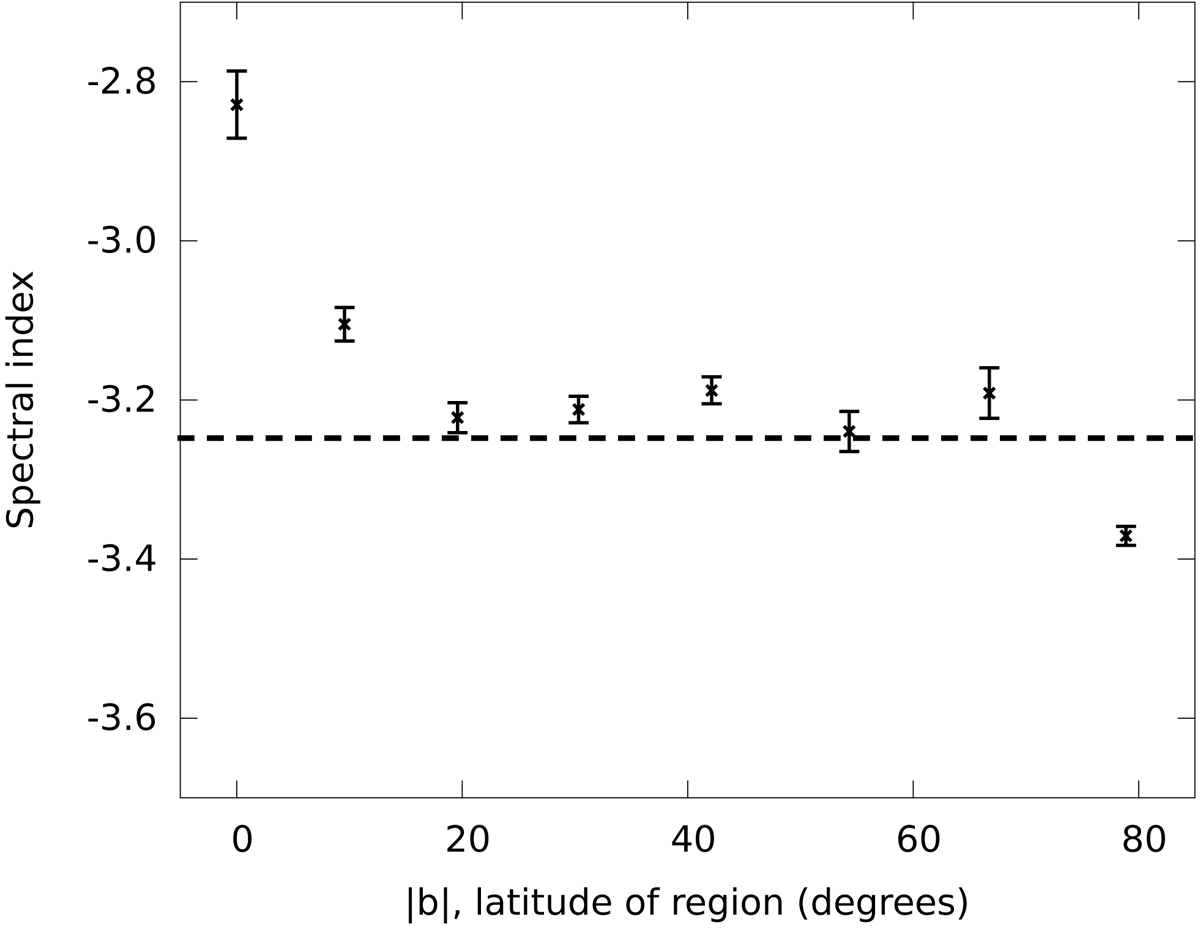
Polarized synchrotron spectral index as a function of the absolute value of latitude for the Faraday-corrected data (RM-SPASS). Regions at the same latitude are combined by estimating the inverse-variance weighted mean. Only regions for which the Pearson correlation coefficient is r > 0.2 are included. The horizontal line shows the inverse-variance weighted mean values of all regions, βtot = −3.24.
Current usage metrics show cumulative count of Article Views (full-text article views including HTML views, PDF and ePub downloads, according to the available data) and Abstracts Views on Vision4Press platform.
Data correspond to usage on the plateform after 2015. The current usage metrics is available 48-96 hours after online publication and is updated daily on week days.
Initial download of the metrics may take a while.