Fig. C.2
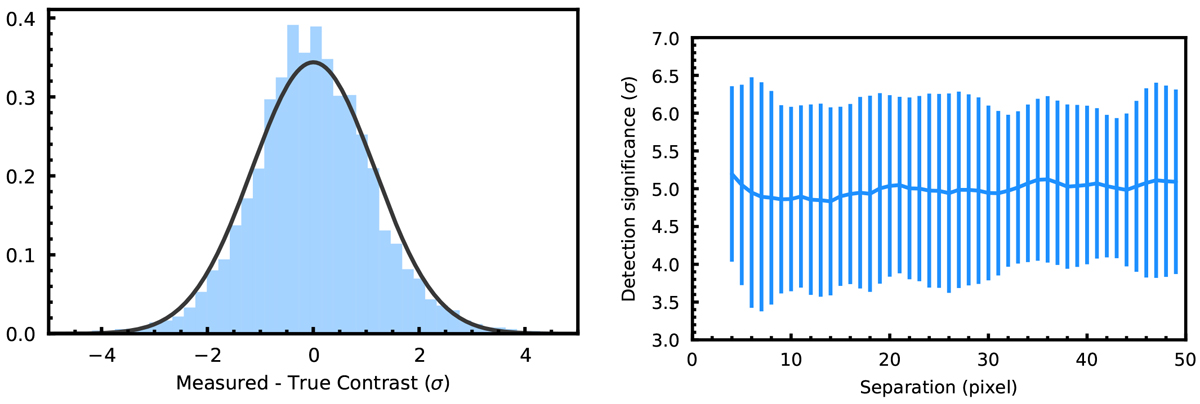
Left: histogram of deviation of retrieved contrast from true values after separation dependent bias correction for injected 5 σ signals in the whole reduced FoV, overplotted with a Gaussian fit. Right: mean and standard deviation of detection significance of injected 5 σ signal over the separation computed in three-pixel-wide annuli after separation dependent bias correction.
Current usage metrics show cumulative count of Article Views (full-text article views including HTML views, PDF and ePub downloads, according to the available data) and Abstracts Views on Vision4Press platform.
Data correspond to usage on the plateform after 2015. The current usage metrics is available 48-96 hours after online publication and is updated daily on week days.
Initial download of the metrics may take a while.