Fig. 2
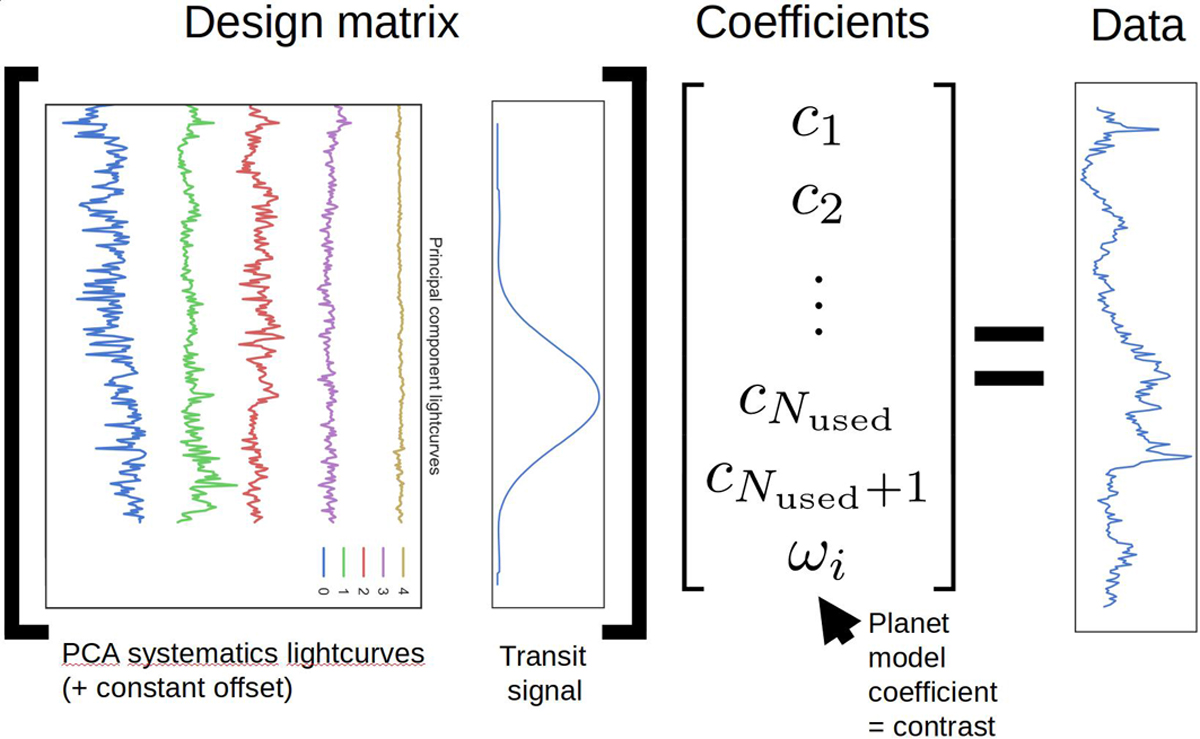
Example for Eq. (11), showing the first five principal component light curves and the planet model. The constant offset term (![]() ) is not shown in the design matrix. This example shows a pixel with a bright (10−4 contrast) injected planet signal based on 51 Eri b data. The data corresponds to the central pixel in the injected planet’s trajectory shown in Fig. 1 at the location marked by the pink cross. The principal components were determined from the reference pixels,
) is not shown in the design matrix. This example shows a pixel with a bright (10−4 contrast) injected planet signal based on 51 Eri b data. The data corresponds to the central pixel in the injected planet’s trajectory shown in Fig. 1 at the location marked by the pink cross. The principal components were determined from the reference pixels, ![]() , shown in white.
, shown in white.
Current usage metrics show cumulative count of Article Views (full-text article views including HTML views, PDF and ePub downloads, according to the available data) and Abstracts Views on Vision4Press platform.
Data correspond to usage on the plateform after 2015. The current usage metrics is available 48-96 hours after online publication and is updated daily on week days.
Initial download of the metrics may take a while.