Fig. 16
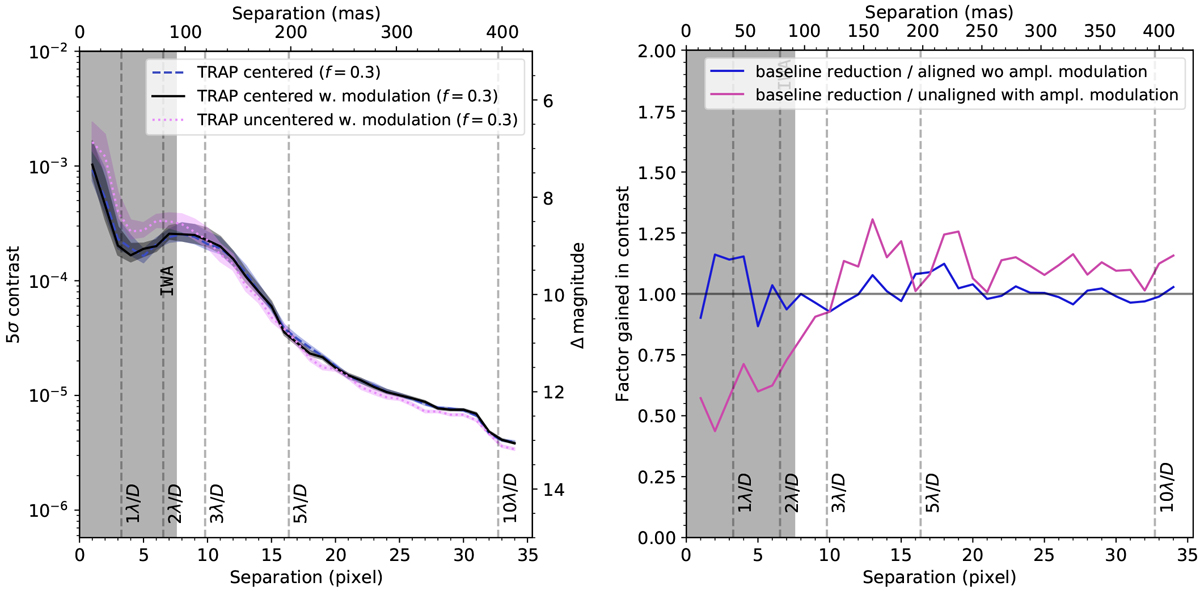
Left: comparison between the contrast for β Pic obtained with TRAP on: (1) aligned data not taking into account the brightness modulation; (2) same but taking into account the brightness modulation; and (3) unaligned data with the brightness modulation. TRAP was run with 30% of available principal components. The shaded areas around the lines correspond to the 14–84% percentile interval of contrast values at a given separation. Right: contrast gain compared to aligned data without including amplitude variations (baseline reduction). Figure description is analogous to that of Fig. 7.
Current usage metrics show cumulative count of Article Views (full-text article views including HTML views, PDF and ePub downloads, according to the available data) and Abstracts Views on Vision4Press platform.
Data correspond to usage on the plateform after 2015. The current usage metrics is available 48-96 hours after online publication and is updated daily on week days.
Initial download of the metrics may take a while.