Fig. 12
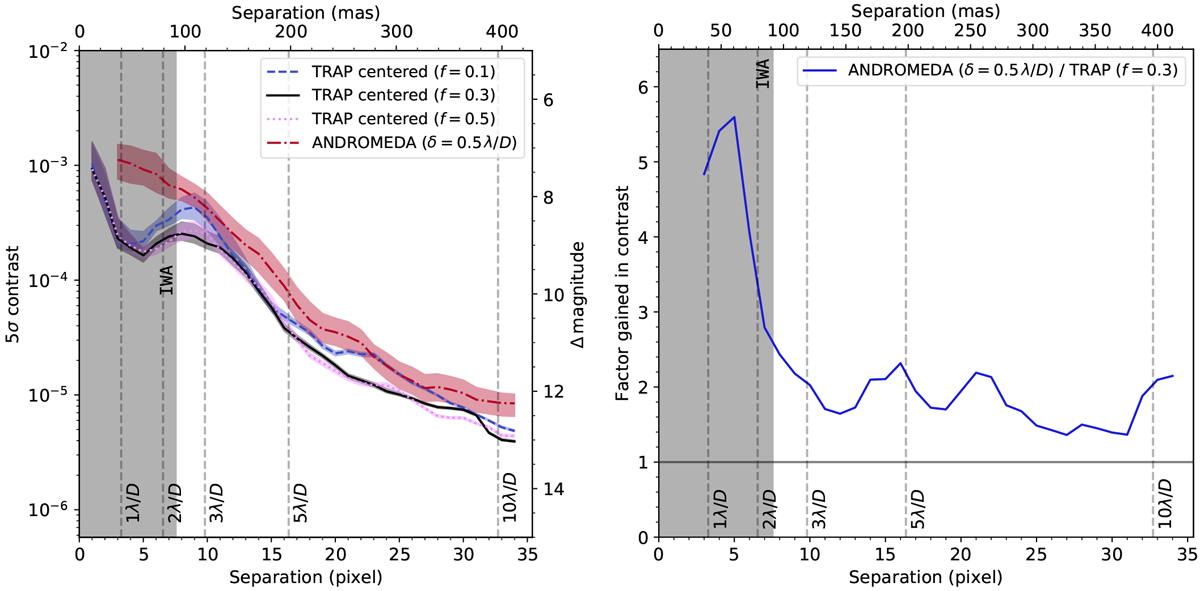
Comparison between the contrast obtained with TRAP and ANDROMEDA reductions for β Pic using the same input data for the H2 band. TRAP has been run with 10, 30, and 50% of available principal components, whereas the ANDROMEDA reduction correspond to a protection angle of δ = 0.5 λ∕D. Separations below the inner-working angle of the coronagraph are shaded and should only be interpreted relative to each other, not in terms of absolute contrast, because the impact of coronagraphic signal transmission is not included in the forward model of either pipeline. Left: shaded areas around the lines correspond to the 14–84% percentile interval of contrast values at a given separation. Right: contrast gained by using TRAP.
Current usage metrics show cumulative count of Article Views (full-text article views including HTML views, PDF and ePub downloads, according to the available data) and Abstracts Views on Vision4Press platform.
Data correspond to usage on the plateform after 2015. The current usage metrics is available 48-96 hours after online publication and is updated daily on week days.
Initial download of the metrics may take a while.