Free Access
Fig. 8.
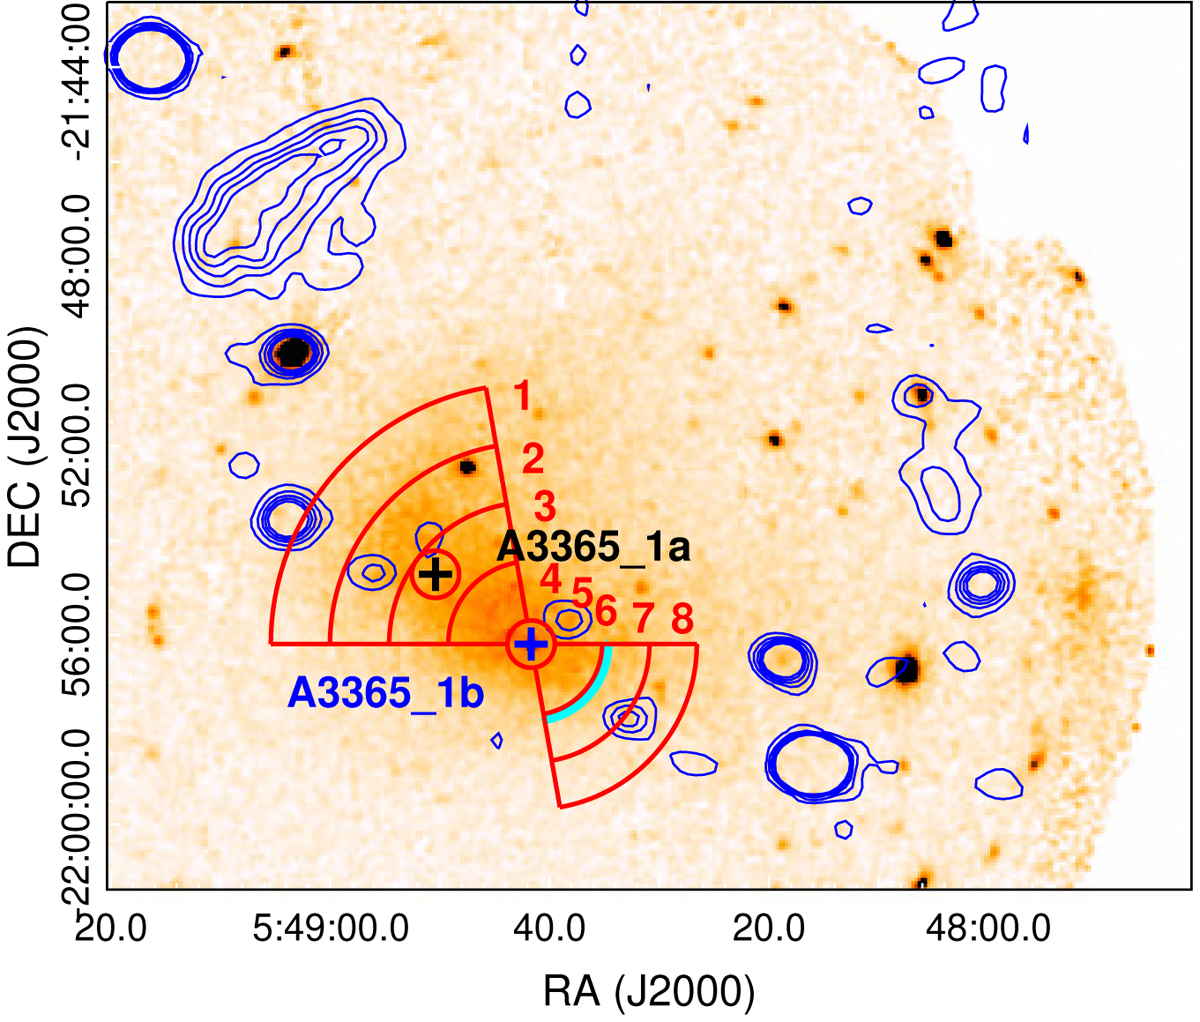
Same as Fig. 1, where the red sectors represent the regions used for the temperature and abundance distributions. The cyan line shows the location of the cold front. The center of A3365_1a and the A3365_1b are marked with black and blue crosses.
Current usage metrics show cumulative count of Article Views (full-text article views including HTML views, PDF and ePub downloads, according to the available data) and Abstracts Views on Vision4Press platform.
Data correspond to usage on the plateform after 2015. The current usage metrics is available 48-96 hours after online publication and is updated daily on week days.
Initial download of the metrics may take a while.