Fig. 7.
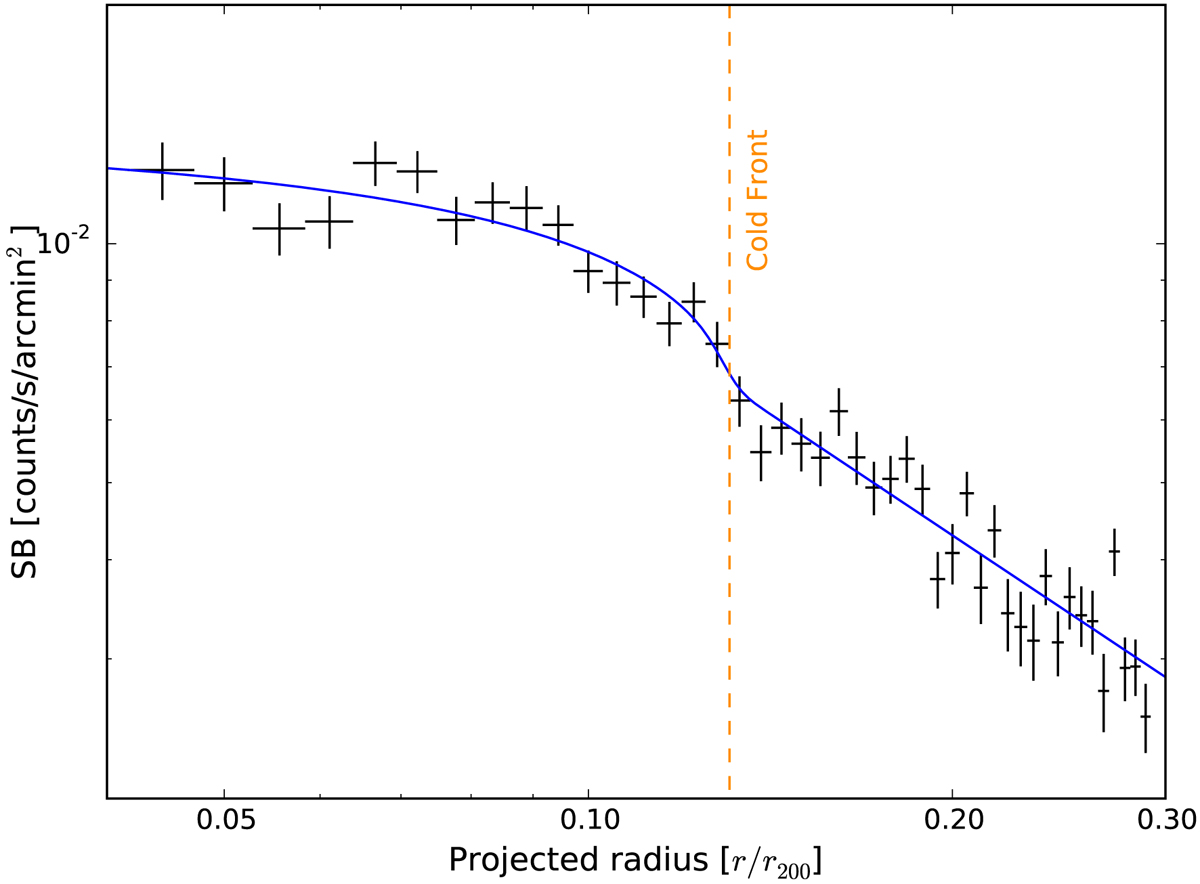
Radial X-ray SB profile across the cold front in the 0.5–2.0 keV band using the XMM-Newton observations. The profile is corrected for exposure, background and soft protons, and point sources are removed. The best-fit model is shown in blue and the vertical dashed orange line represents the estimated position of the cold front.
Current usage metrics show cumulative count of Article Views (full-text article views including HTML views, PDF and ePub downloads, according to the available data) and Abstracts Views on Vision4Press platform.
Data correspond to usage on the plateform after 2015. The current usage metrics is available 48-96 hours after online publication and is updated daily on week days.
Initial download of the metrics may take a while.