Fig. 6.
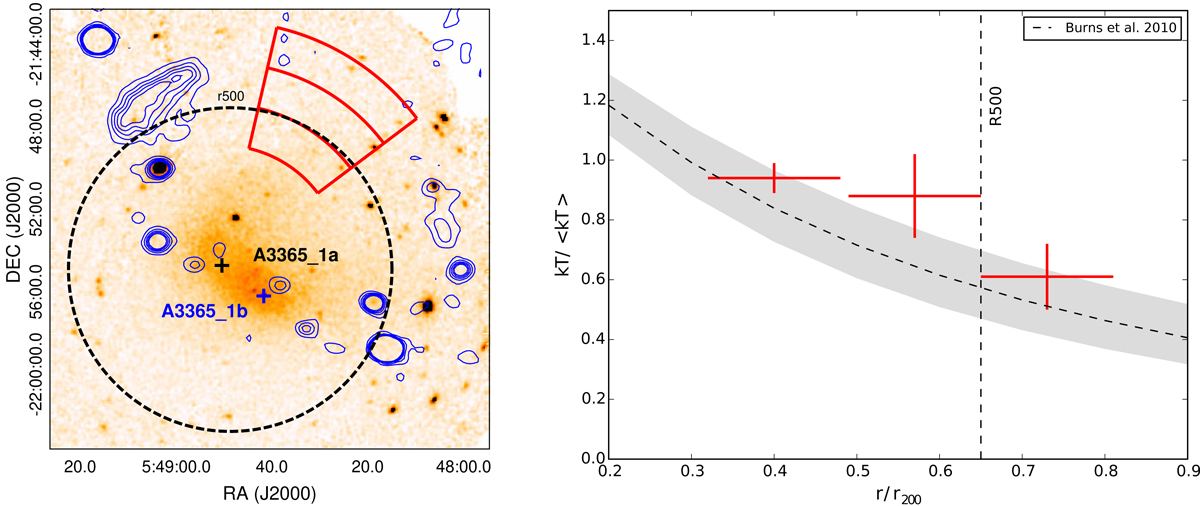
Left panel: same as Fig. 1, showing extraction regions for the “relaxed” direction of the cluster (orthogonal to the merging axis) in red. The black dashed circle represents r500. The center of A3365_1a and A3365_1b are marked with black and blue crosses. Right panel: temperature distribution of the red sectors compared with the Burns et al. (2010) “universal” profile for relaxed clusters. The gray shaded area shows the 1σ scatter.
Current usage metrics show cumulative count of Article Views (full-text article views including HTML views, PDF and ePub downloads, according to the available data) and Abstracts Views on Vision4Press platform.
Data correspond to usage on the plateform after 2015. The current usage metrics is available 48-96 hours after online publication and is updated daily on week days.
Initial download of the metrics may take a while.