Fig. 4.
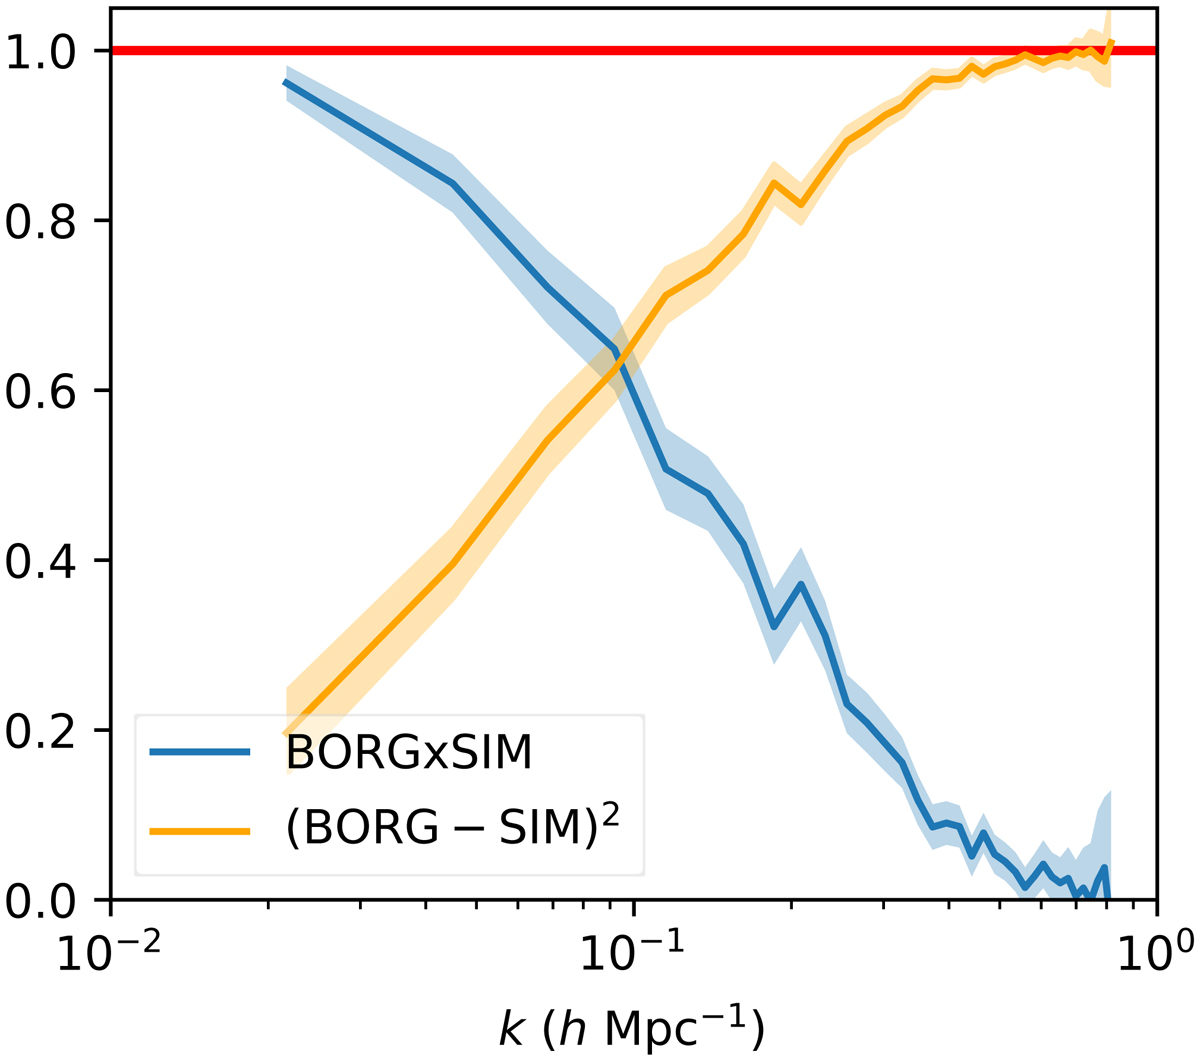
Correlation (blue color) and error residual (orange) for the density field inferred by BORG compared to the simulation density field. We compute the mean and one standard deviation using the posterior distribution sampled by the BORG chain. Both curves are normalized by the power spectrum of each field. We see that indeed when correlation is weak, we get the maximum relative variance.
Current usage metrics show cumulative count of Article Views (full-text article views including HTML views, PDF and ePub downloads, according to the available data) and Abstracts Views on Vision4Press platform.
Data correspond to usage on the plateform after 2015. The current usage metrics is available 48-96 hours after online publication and is updated daily on week days.
Initial download of the metrics may take a while.