Fig. 2.
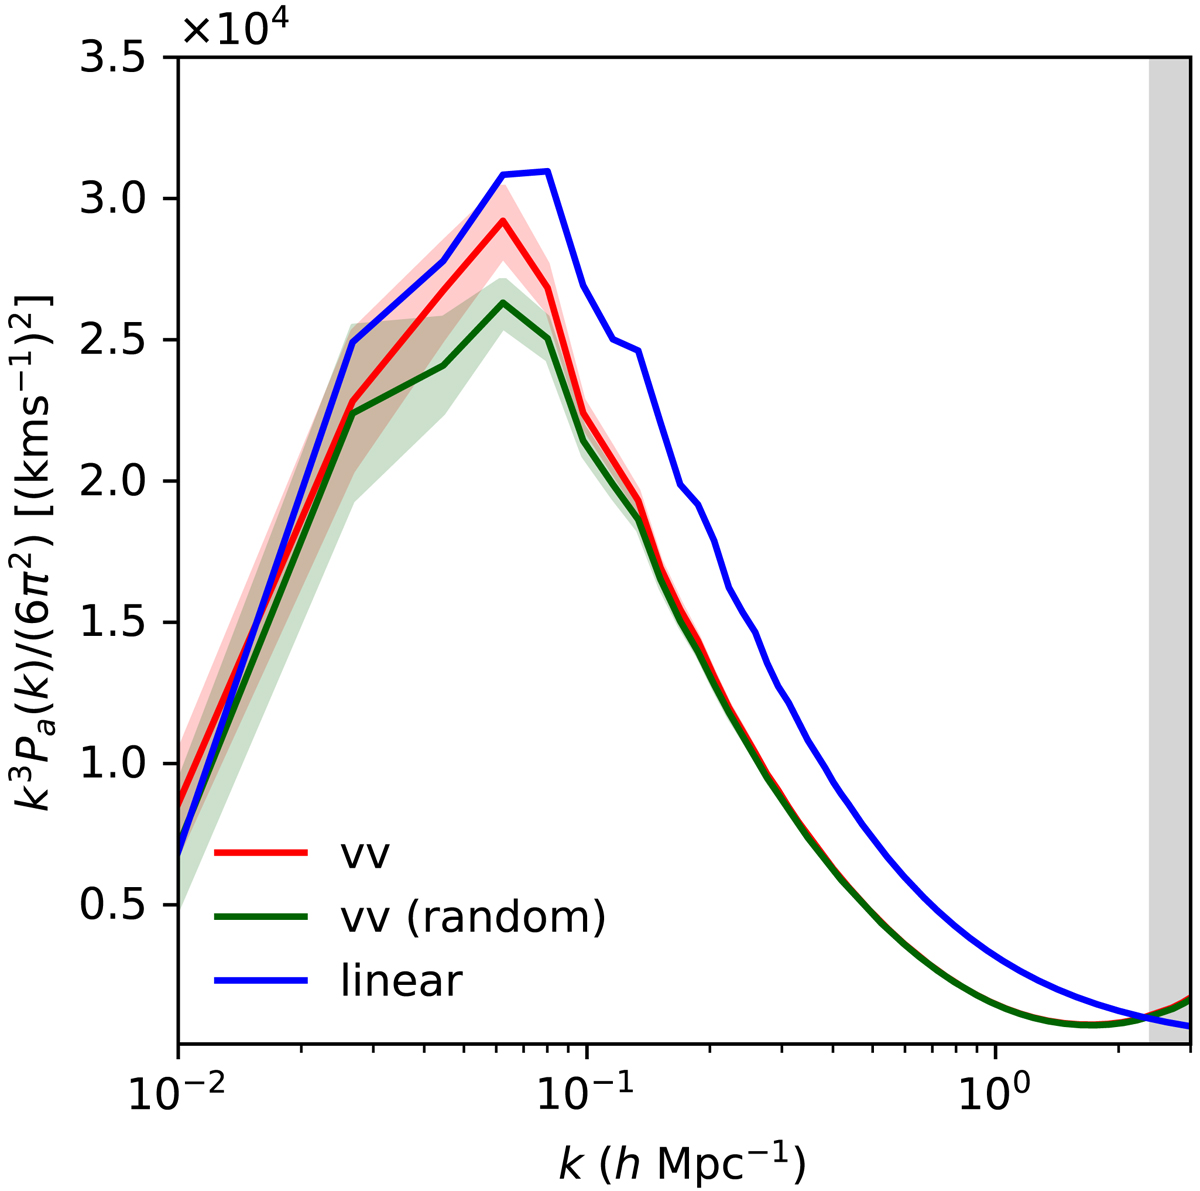
Ensemble average power-spectrum of the non-linear velocity field scaled, alongside with one standard deviation contour in the shaded area. The line and shaded region in red are computed from the ensemble posterior distribution built from the 2M++ data. The line and shaded region in green are measured from 80 random realizations of a ΛCDM universe of the same size. Those random realizations were computed using the same N-body solver, but starting from a random sample of a Gaussian distribution with a power-spectrum provided by the ΛCDM model. We show in thick blue line the power spectrum assuming linear theory. We note that large scales are unaffected by non-linearities. Intermediate scales (k ≳ 0.1 h Mpc−1, corresponding to ∼60 h Mpc−1) get non-negligible contributions from non-linear dynamics, as highlighted by the area under the curve. The vertical grey band on the right side indicate the resolution limit of the BORG reconstruction (∼2.6 h Mpc−1).
Current usage metrics show cumulative count of Article Views (full-text article views including HTML views, PDF and ePub downloads, according to the available data) and Abstracts Views on Vision4Press platform.
Data correspond to usage on the plateform after 2015. The current usage metrics is available 48-96 hours after online publication and is updated daily on week days.
Initial download of the metrics may take a while.