Fig. 10.
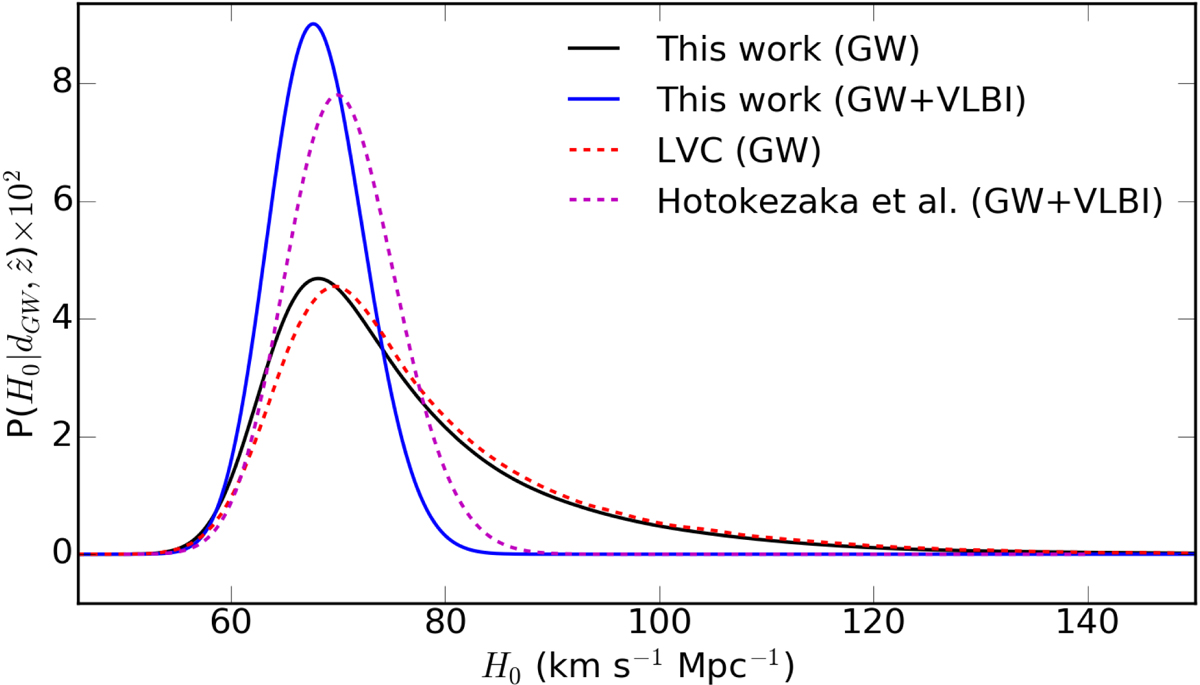
Posterior of H0 for GW170817 is obtained using the peculiar velocity correction by our method and is shown in black when we use the GW data and in blue when using the GW and VLBI data. We also show the H0 measurement from the LIGO Scientific Collaboration and Virgo Collaboration (LVC) in dashed red line (Abbott et al. 2017a) and the magenta dashes presents the result from Hotokezaka et al. (2019) from hydrodynamics simulation jet using a GW+VLBI observation.
Current usage metrics show cumulative count of Article Views (full-text article views including HTML views, PDF and ePub downloads, according to the available data) and Abstracts Views on Vision4Press platform.
Data correspond to usage on the plateform after 2015. The current usage metrics is available 48-96 hours after online publication and is updated daily on week days.
Initial download of the metrics may take a while.