Fig. E.1.
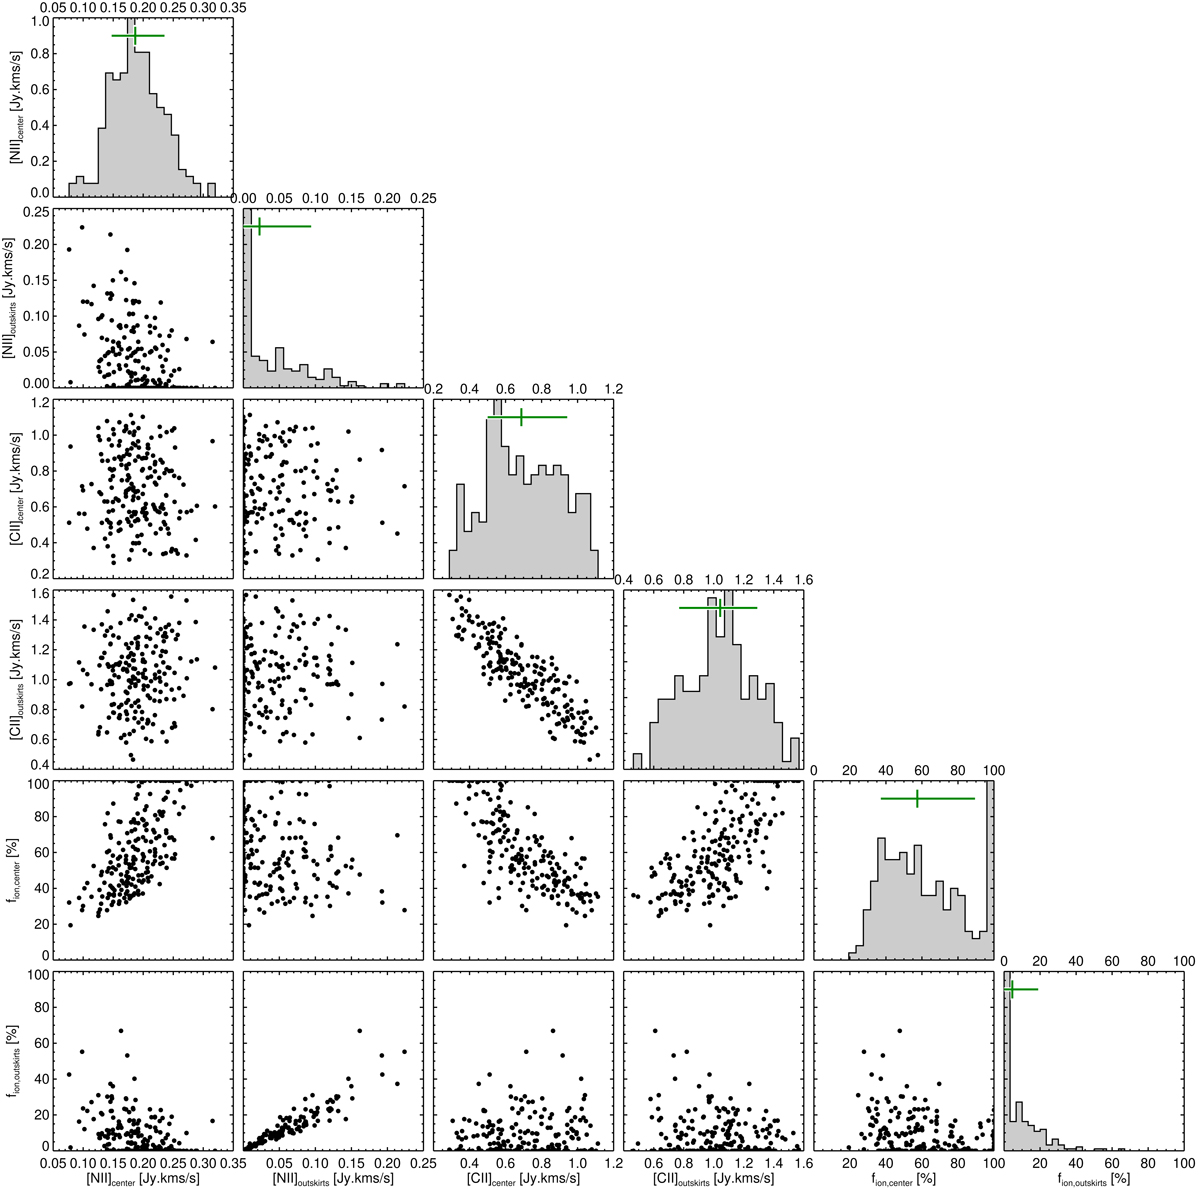
Joint distribution of the fluxes, flux ratios, and ionized gas fraction in the Monte Carlo simulations executed for the real images. As is customary, on the diagonal we show the histogram of each quantity; the y-axis for these plots is scaled automatically to include the maximum counts in a bin. The green horizontal bars correspond the 16th and 84th percentiles, which we report as uncertainties, and the horizontal green bar is the best-fit value.
Current usage metrics show cumulative count of Article Views (full-text article views including HTML views, PDF and ePub downloads, according to the available data) and Abstracts Views on Vision4Press platform.
Data correspond to usage on the plateform after 2015. The current usage metrics is available 48-96 hours after online publication and is updated daily on week days.
Initial download of the metrics may take a while.