Fig. D.1.
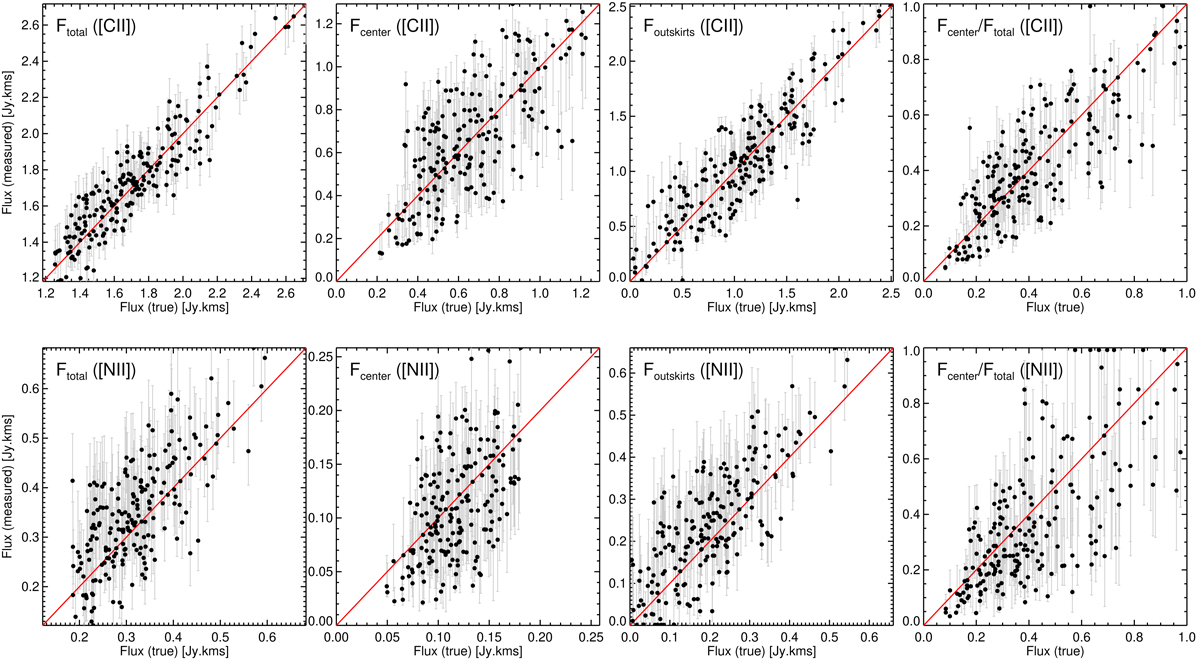
Outcome of the input/output analysis of our fitting procedure, modeling sources of known profiles in mock images. The simulations matching the [C II] and [N II] maps are shown at the top and bottom, respectively. From left to right: we show how our method recovers the total flux, the flux inside the center, the flux in the outskirts, and the ratio of center-to-total (with “center” and “outskirts” as defined in the main text). The red line is the line of perfect agreement.
Current usage metrics show cumulative count of Article Views (full-text article views including HTML views, PDF and ePub downloads, according to the available data) and Abstracts Views on Vision4Press platform.
Data correspond to usage on the plateform after 2015. The current usage metrics is available 48-96 hours after online publication and is updated daily on week days.
Initial download of the metrics may take a while.