Fig. A.1.
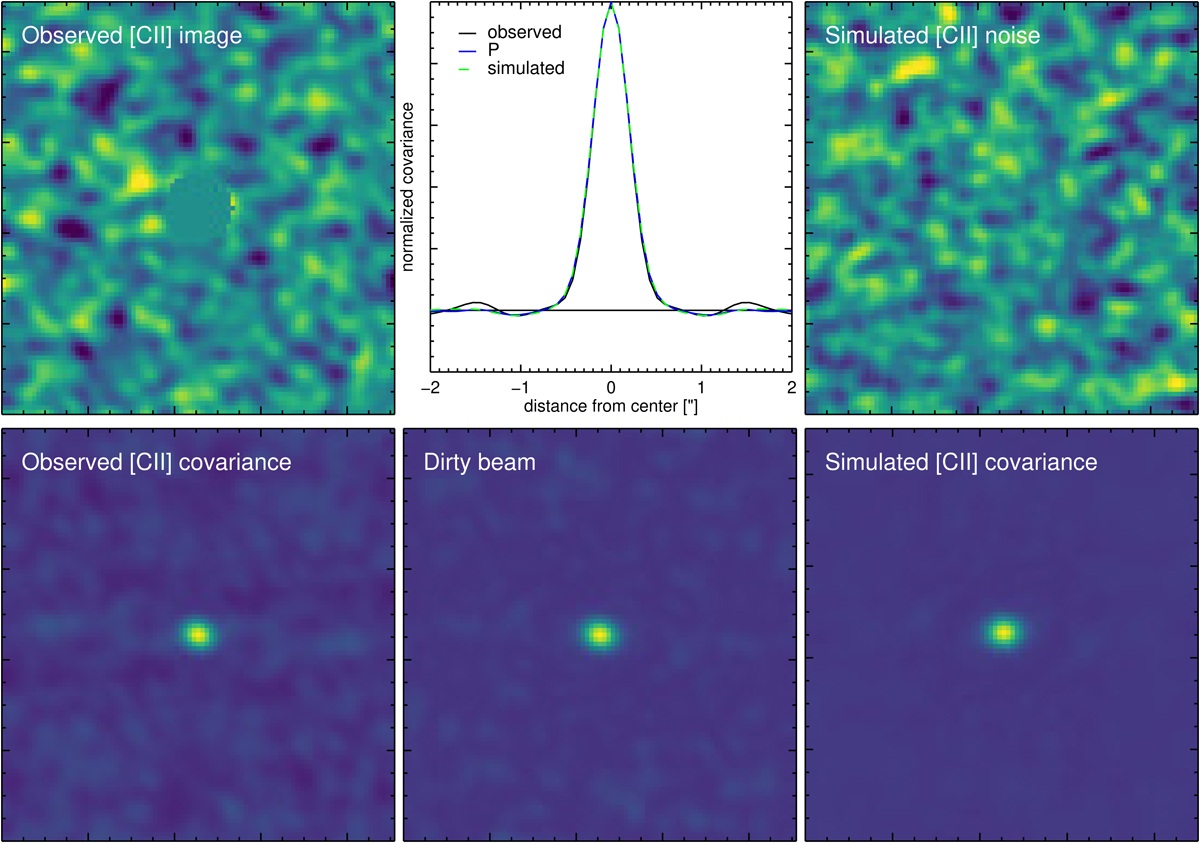
Observed and simulated noise maps (top) and their respective auto-correlation functions (bottom). The real [C II] map is displayed in the top left corner, with the source masked in the center. For comparison, we also display the [C II] dirty beam in the middle of the bottom panel. All the images on each row are displayed with the same color bar. The auto-correlation functions were rescaled prior to display to a peak value of unity. For easier comparison, we also show a circular average of the covariance in the central column of the first row, with the observed (black) and simulated (green dashed) auto-correlation functions, and the dirty-beam profile (blue).
Current usage metrics show cumulative count of Article Views (full-text article views including HTML views, PDF and ePub downloads, according to the available data) and Abstracts Views on Vision4Press platform.
Data correspond to usage on the plateform after 2015. The current usage metrics is available 48-96 hours after online publication and is updated daily on week days.
Initial download of the metrics may take a while.