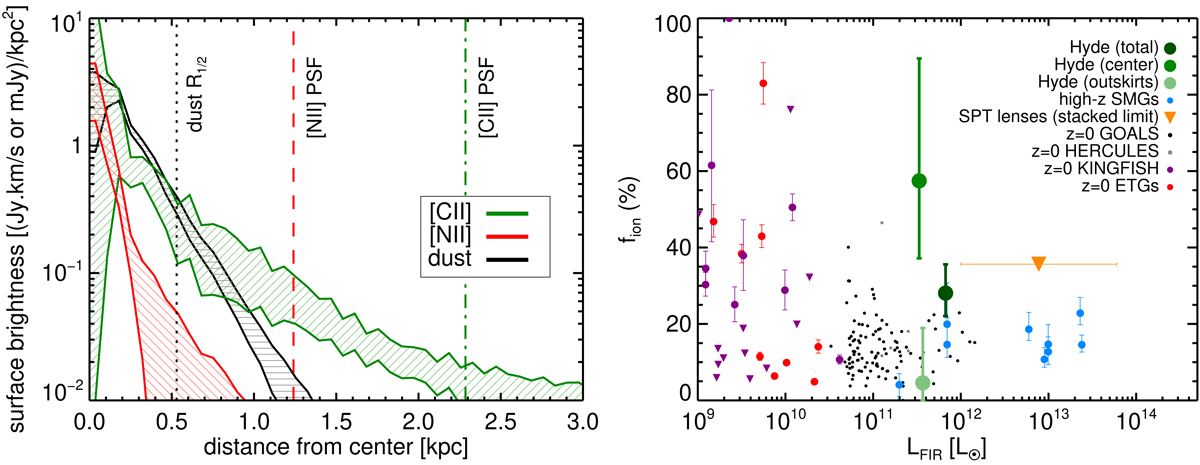
Fig. 4.
Left: modeled intrinsic surface brightness profiles of Hyde in the dust continuum (black, horizontal stripes), [C II] (green, +45° stripes), and [N II] (red, −45° stripes). The dust continuum half-light radius is indicated with a vertical dotted black line. The PSF HWHM of the [C II] (resp. [N II]) line map is indicated with vertical dot dashed (resp. dashed) green (resp. red) line. The hashed regions show the 1σ confidence intervals obtained from the 200 mock noise realizations and are centered on the best-fit model. Right: ionized gas fraction (f[C II],ion) determined from the [C II]/[N II] line ratio in different regions of Hyde (green circles; center, outskirts, and total), compared to other values reported in the literature. For all galaxies, the ionized gas fraction was computed assuming a fixed [C II]ion/[N II]ion = 2.80 ± 0.18 (see text). We show literature values for local ETGs (red circles) and KINGFISH galaxies (purple circles) from Lapham et al. (2017), local infrared luminous galaxies in GOALS (black circles) from Zhao et al. (2016) and Díaz-Santos et al. (2017), and HERCULES from Rosenberg et al. (2015) and Kamenetzky et al. (2016), and high-redshift SMGs from Pavesi et al. (2016). We also show the upper limit of Zhang et al. (2018), obtained by stacking high-redshift lensed SMGs (downward-pointing orange triangle).
Current usage metrics show cumulative count of Article Views (full-text article views including HTML views, PDF and ePub downloads, according to the available data) and Abstracts Views on Vision4Press platform.
Data correspond to usage on the plateform after 2015. The current usage metrics is available 48-96 hours after online publication and is updated daily on week days.
Initial download of the metrics may take a while.