Fig. 3.
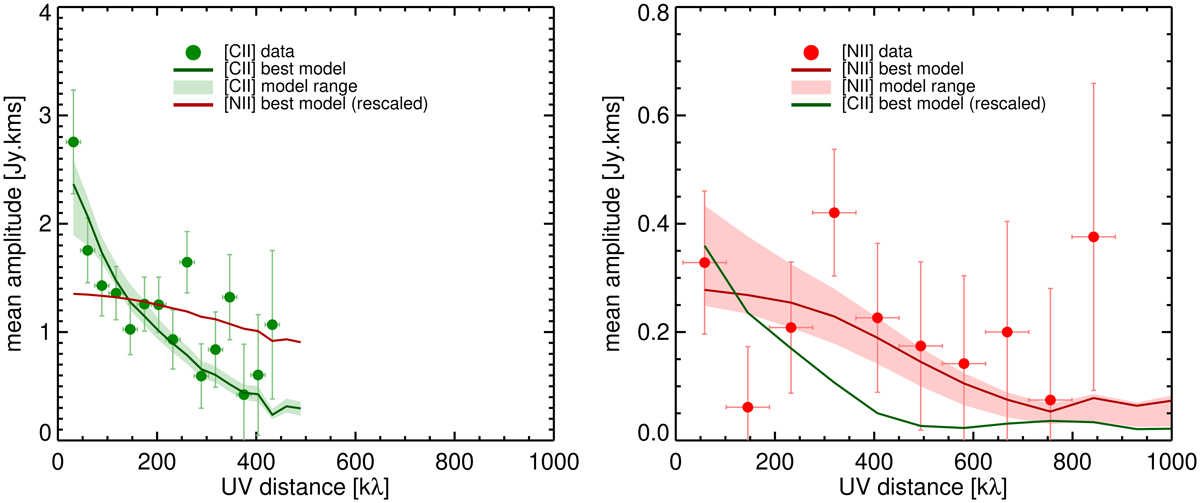
Binned amplitude of the ALMA visibilities as a function of the UV distance (u2 + v2). The [C II] visibilities are shown on the left (green) and the [N II] visibilities are shown on the right (red). Observed visibilities are displayed as filled circles with error bars; for clarity, the visibilities on long baselines, which have large uncertainties, are not displayed. The best-fit models obtained in this paper (from the image-domain analysis) are shown as solid lines (green for [C II], red for [N II]). For comparison purposes, on each panel, the model of the other line is also displayed, but re-normalized to fit the observed visibilities. The 1σ confidence interval of the model (determined from our Monte Carlo simulations) is shown as a shaded region in the background.
Current usage metrics show cumulative count of Article Views (full-text article views including HTML views, PDF and ePub downloads, according to the available data) and Abstracts Views on Vision4Press platform.
Data correspond to usage on the plateform after 2015. The current usage metrics is available 48-96 hours after online publication and is updated daily on week days.
Initial download of the metrics may take a while.