Fig. 2.
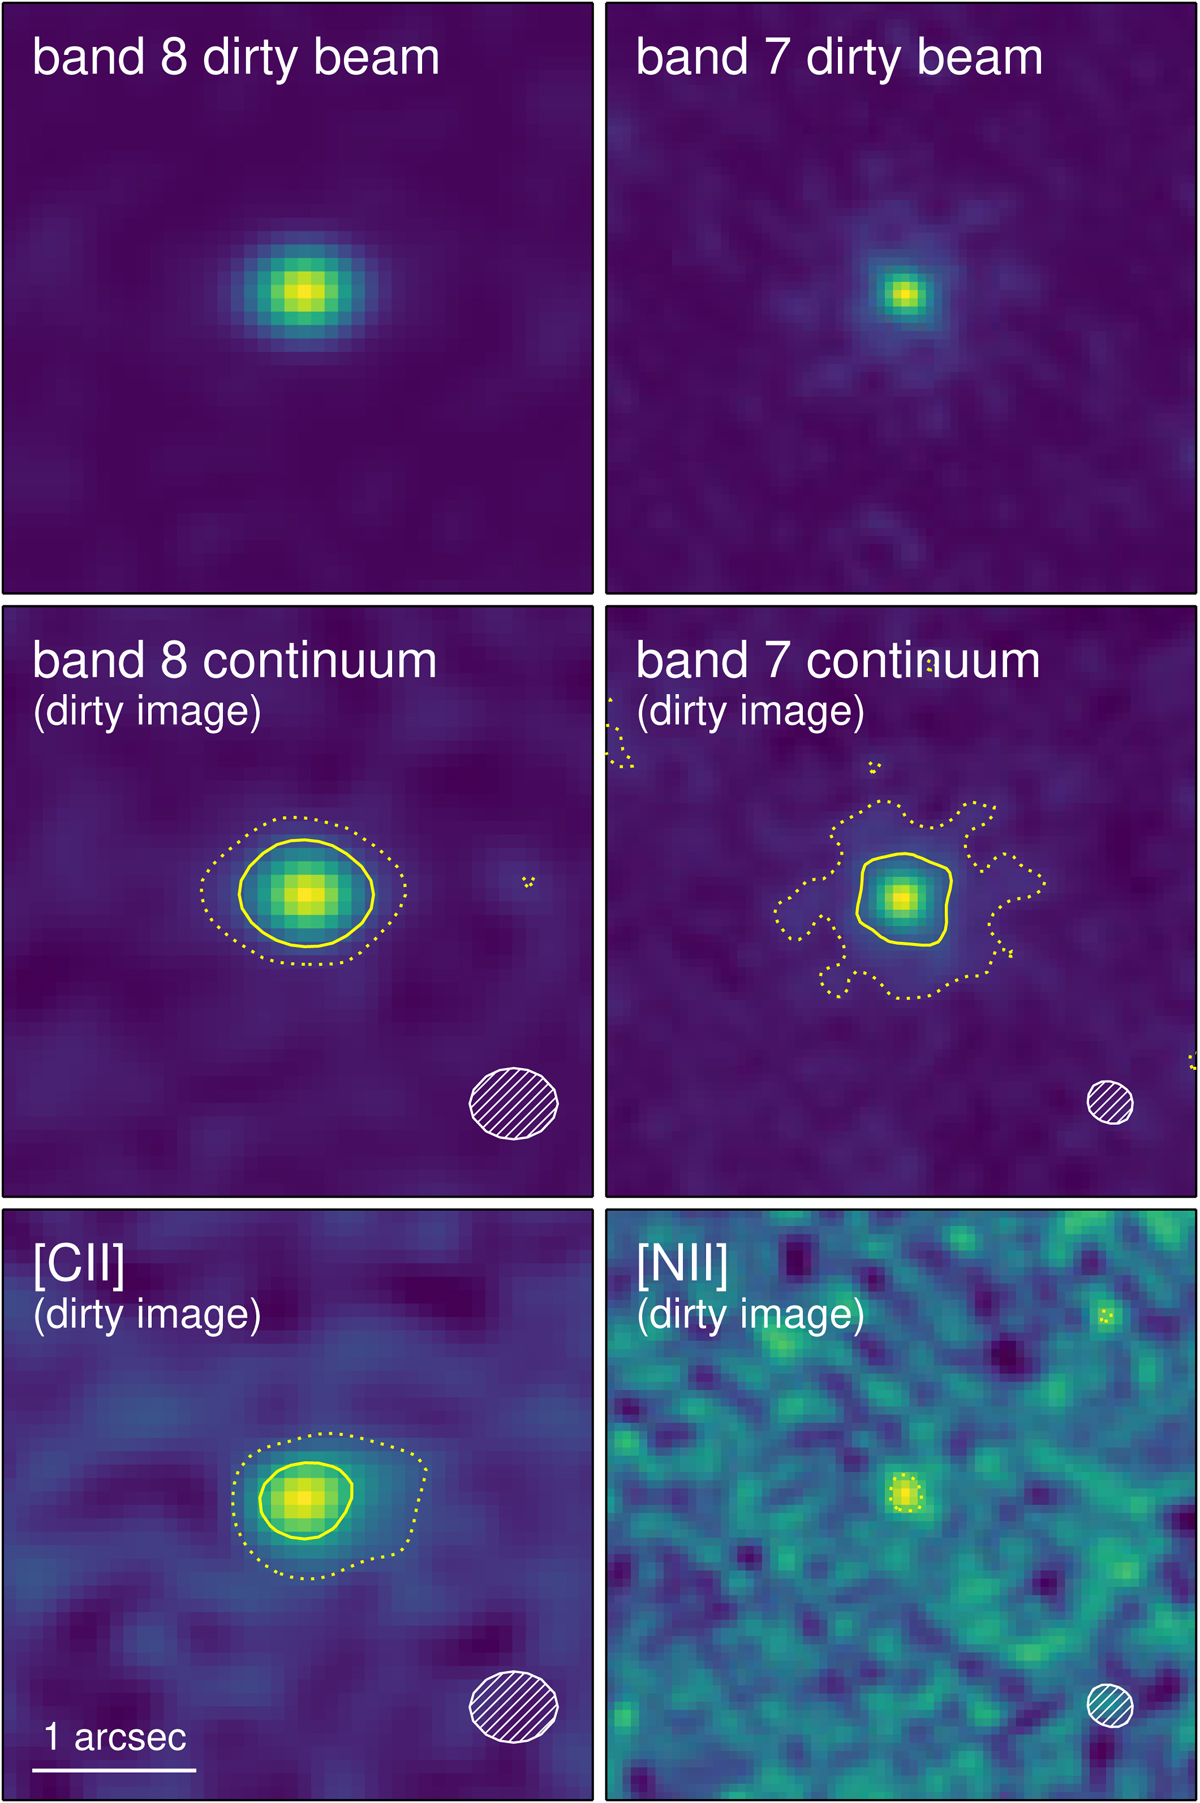
Dirty beam (top), continuum (center), and line maps (bottom) in band 8 (left) and 7 (right) produced by the ALMA pipeline, without any cleaning applied (“dirty” images). Line maps are continuum-subtracted and were produced by summing the flux in a 800 km s−1 velocity window centered on the [C II] mean velocity. The half-intensity area of the corresponding dirty beams are shown in the bottom-right corner of each panel. Contours shown are 3σ (dotted line) and 10σ (solid line).
Current usage metrics show cumulative count of Article Views (full-text article views including HTML views, PDF and ePub downloads, according to the available data) and Abstracts Views on Vision4Press platform.
Data correspond to usage on the plateform after 2015. The current usage metrics is available 48-96 hours after online publication and is updated daily on week days.
Initial download of the metrics may take a while.