Fig. 1.
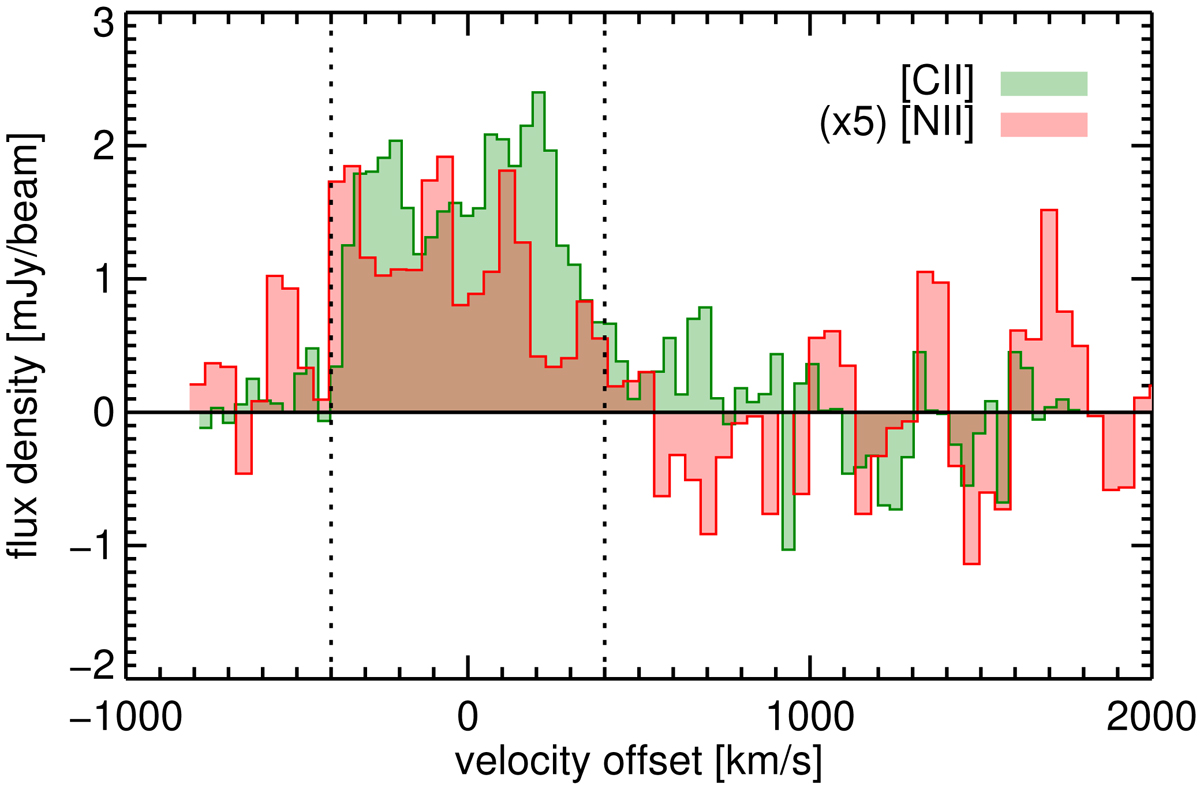
[C II] (green) and [N II] (red) spectra extracted at the peak pixel of the line emission after continuum subtraction. The [N II] spectrum was rescaled upwards by a factor of five for easier comparison to the [C II] spectrum. The integration window used to create the line maps is shown with vertical dotted lines.
Current usage metrics show cumulative count of Article Views (full-text article views including HTML views, PDF and ePub downloads, according to the available data) and Abstracts Views on Vision4Press platform.
Data correspond to usage on the plateform after 2015. The current usage metrics is available 48-96 hours after online publication and is updated daily on week days.
Initial download of the metrics may take a while.