Open Access
Fig. 4.
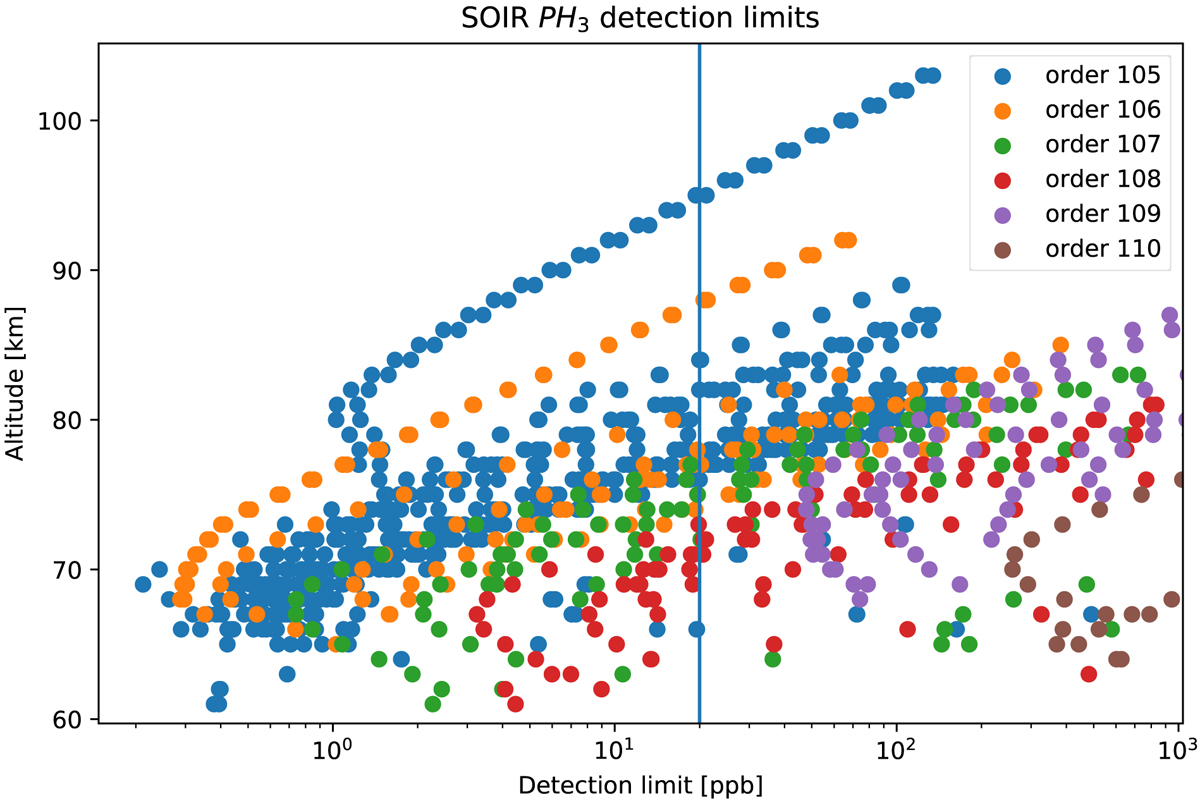
Detection limits as a function of altitude. Colors are the different diffraction orders of SOIR. The blue vertical line corresponds to 20 ppb. The spectral range of the diffraction orders are provided in Table 1.
Current usage metrics show cumulative count of Article Views (full-text article views including HTML views, PDF and ePub downloads, according to the available data) and Abstracts Views on Vision4Press platform.
Data correspond to usage on the plateform after 2015. The current usage metrics is available 48-96 hours after online publication and is updated daily on week days.
Initial download of the metrics may take a while.