Fig. 3.
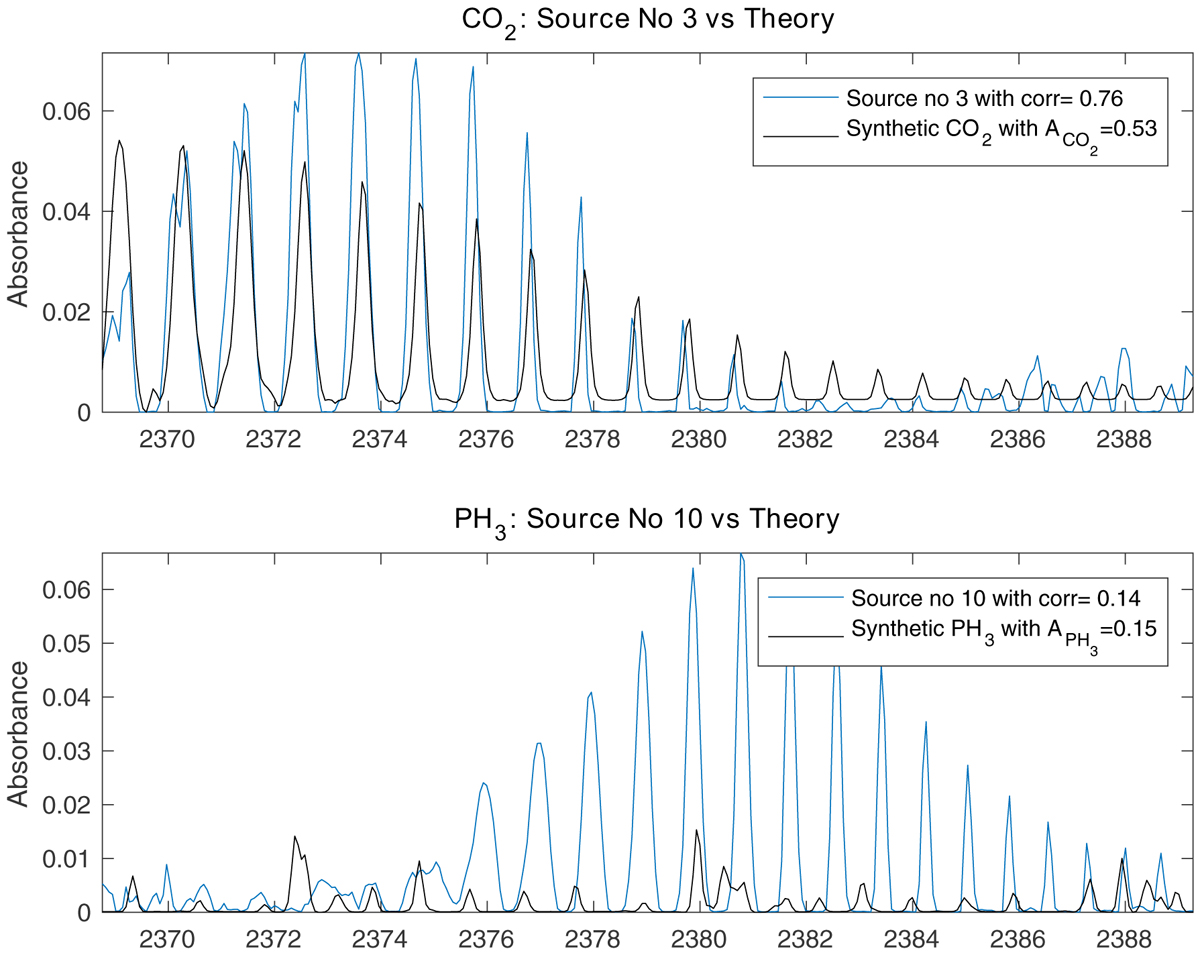
Example of source derived from the machine learning algorithm (in blue) compared to synthetic spectrum (in black) for order 106. The synthetic spectrum is rescaled with fitted linear contribution of CO2 (ACO2) and PH3 (APH3). The correlation coefficient between source and synthetic spectra is noted corr. Above, the source is identified as CO2 (significant ACO2 > 0.5 and high corr > 0.3). Below the closest source (highest APH3) to the PH3 synthetic spectrum is not coherent with its presence (APH3 < 0.5 and corr < 0.3).
Current usage metrics show cumulative count of Article Views (full-text article views including HTML views, PDF and ePub downloads, according to the available data) and Abstracts Views on Vision4Press platform.
Data correspond to usage on the plateform after 2015. The current usage metrics is available 48-96 hours after online publication and is updated daily on week days.
Initial download of the metrics may take a while.