Fig. 1.
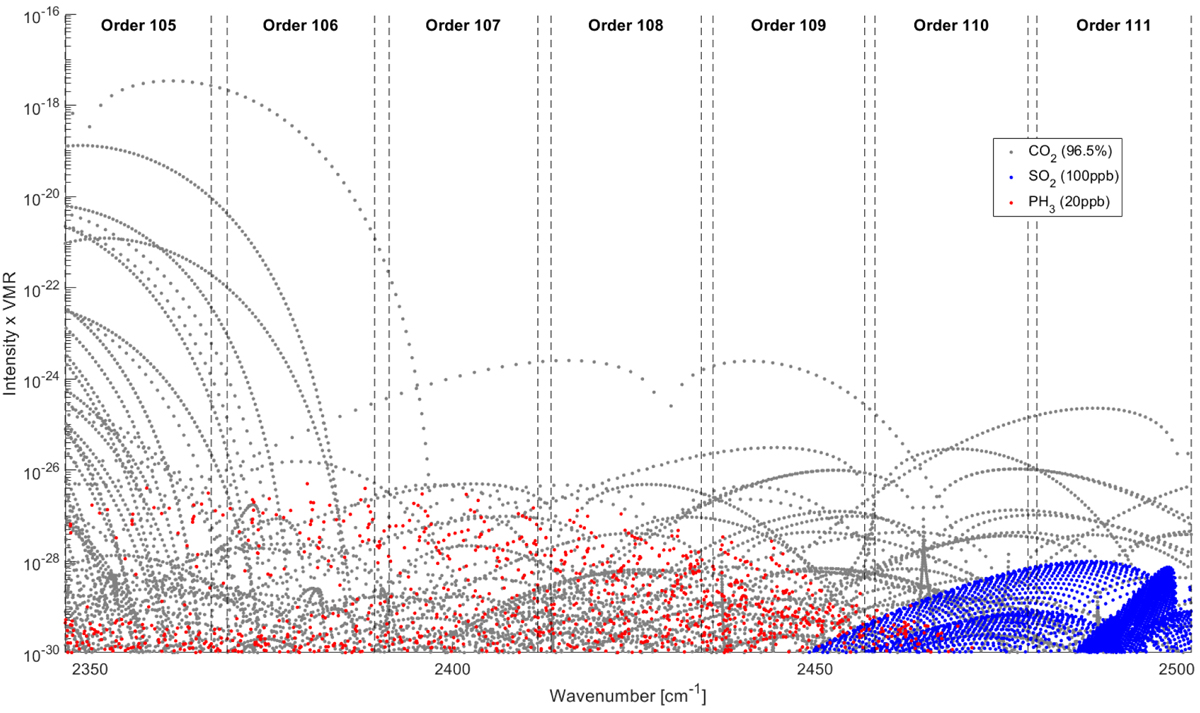
Position of the CO2 (gray), PH3 (red), and SO2 (blue) ro-vibrational transitions in the 2348 to 2501 cm−1 region, corresponding to the SOIR 105 to 111 diffraction orders from HITRAN (Gordon et al. 2017). The line intensities were multiplied by typical Venus abundances, see legend. The SOIR orders are given at the top, with the vertical dashed lines showing their wavenumber extensions.
Current usage metrics show cumulative count of Article Views (full-text article views including HTML views, PDF and ePub downloads, according to the available data) and Abstracts Views on Vision4Press platform.
Data correspond to usage on the plateform after 2015. The current usage metrics is available 48-96 hours after online publication and is updated daily on week days.
Initial download of the metrics may take a while.