Fig. 4
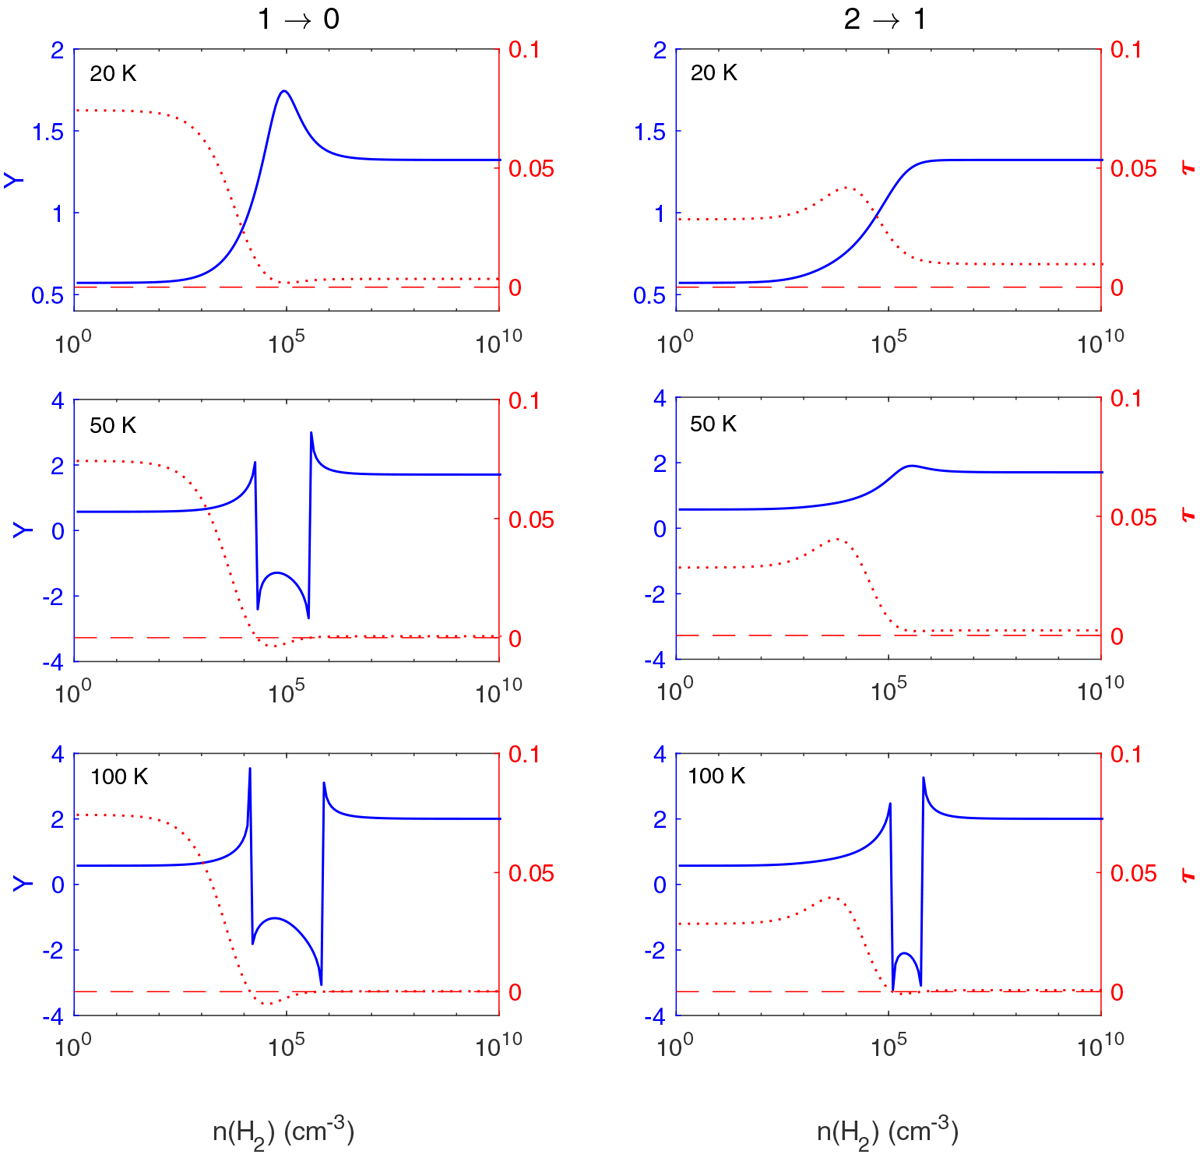
Variation of excitation temperature (blue solid lines) and optical depth (red dotted lines) as a function of H2 -density for the 1 → 0 (left panels) and 2 → 1 (right panels) CF+
rotational transitions at kinetic temperatures of 20 K (upper panels), 50 K (middle panels), and 100 K (lower panels), and a CF+
column density of N(CF+) = 1 × 1012 cm−2. In order to better display the large amplitude of its variation, the excitation temperature is represented on this figure as
![]() .
.
Current usage metrics show cumulative count of Article Views (full-text article views including HTML views, PDF and ePub downloads, according to the available data) and Abstracts Views on Vision4Press platform.
Data correspond to usage on the plateform after 2015. The current usage metrics is available 48-96 hours after online publication and is updated daily on week days.
Initial download of the metrics may take a while.