Fig. 1.
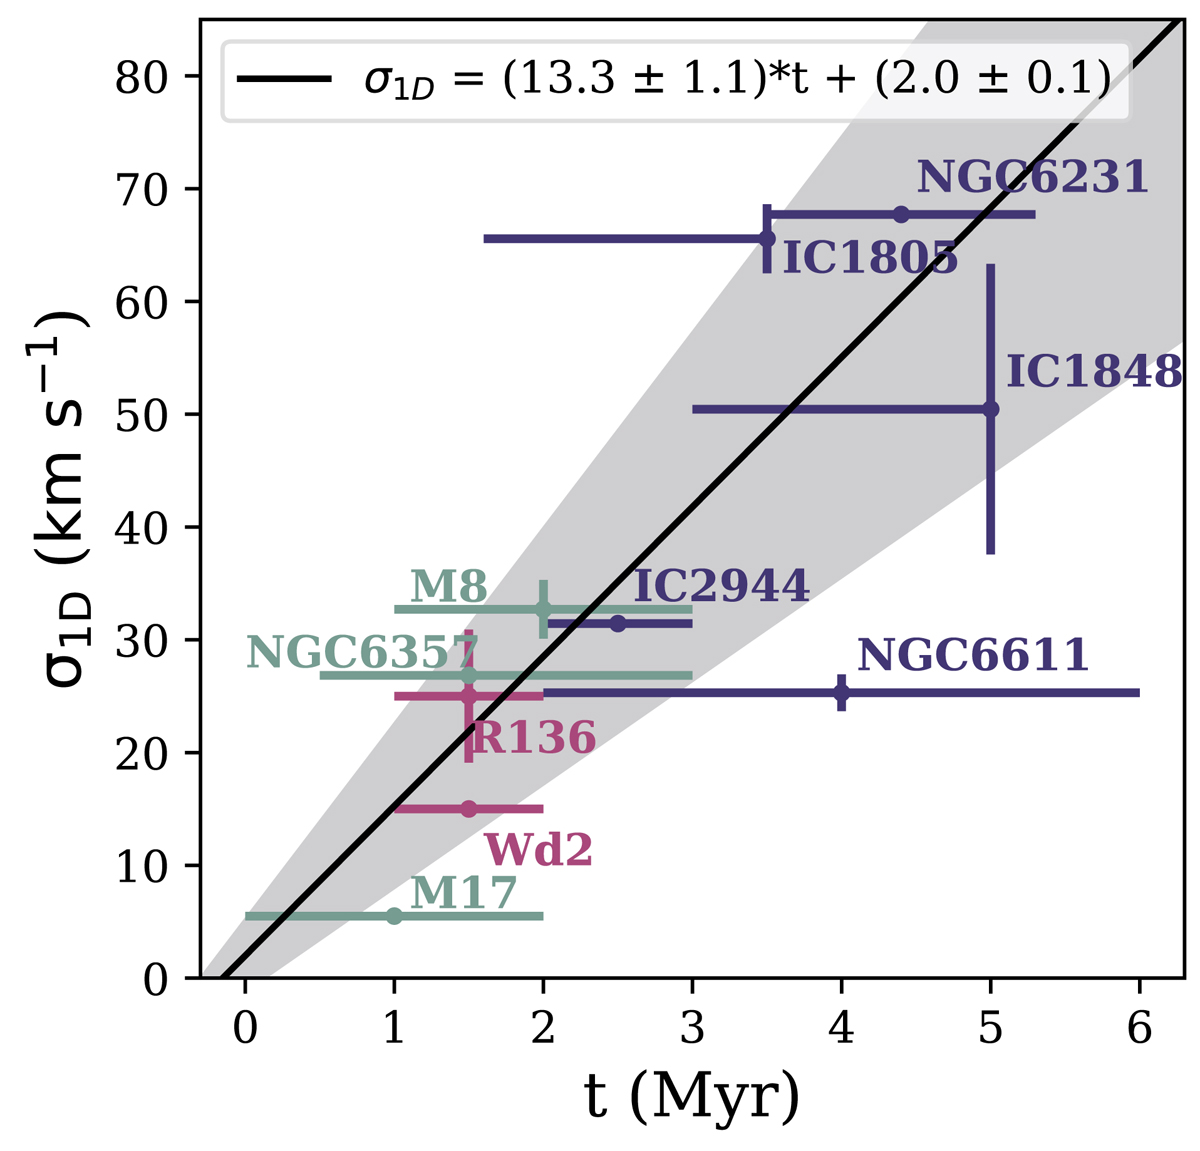
Radial-velocity dispersion (σ1D) versus age of the clusters. The purple data points show the data from Sana et al. (2012), the magenta points show Wd2 and R136 (Zeidler et al. 2018; Hénault-Brunet et al. 2012), and the green data points show the clusters studied in Ramírez-Tannus et al. (2020) and Sana et al. (2017). The solid black line represents the linear fit to the data and the gray area shows the 1-σ errors on the fit.
Current usage metrics show cumulative count of Article Views (full-text article views including HTML views, PDF and ePub downloads, according to the available data) and Abstracts Views on Vision4Press platform.
Data correspond to usage on the plateform after 2015. The current usage metrics is available 48-96 hours after online publication and is updated daily on week days.
Initial download of the metrics may take a while.