Fig. 2.
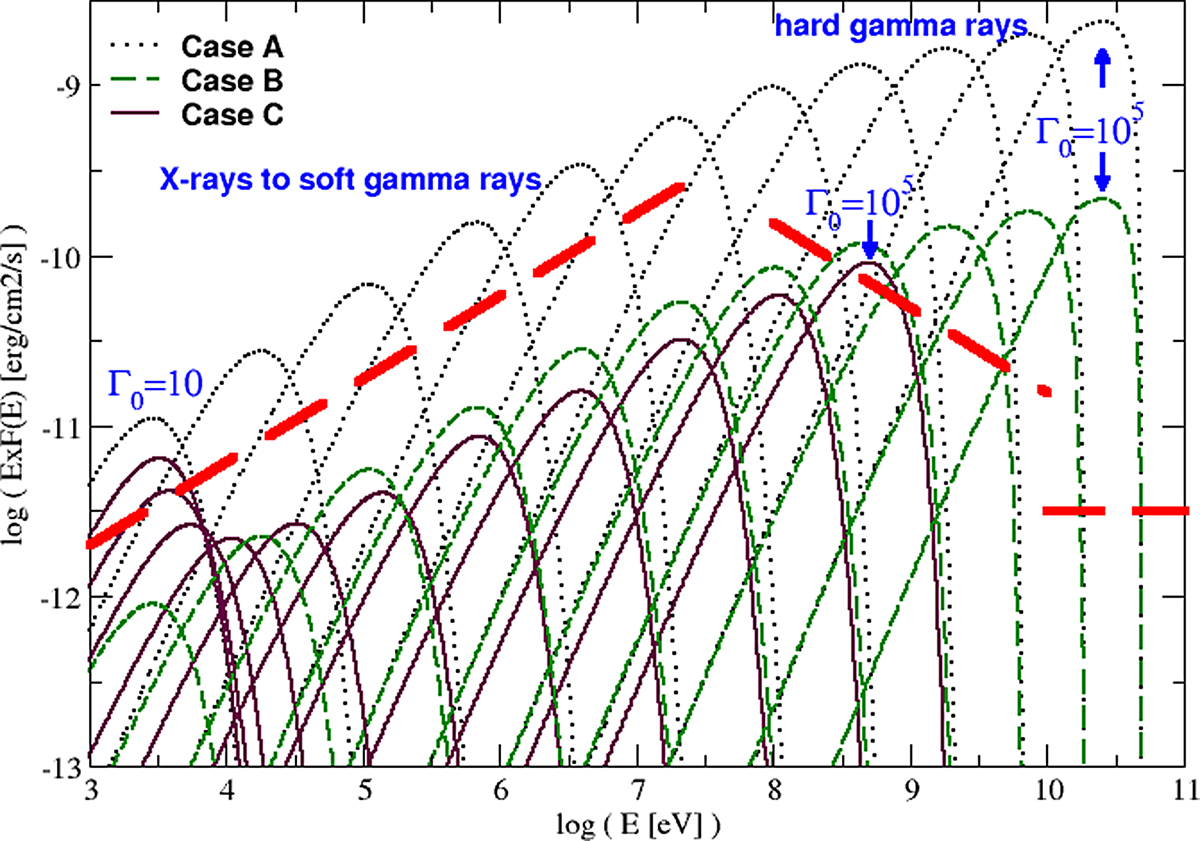
Computed spectral energy distributions of the IC cold pulsar wind emission, at periastron, for 11 different Γp, 0 values from Γp, 0 = 10 to 105, for cases A (dotted lines), B (dashed lines), and C (solid lines) (cases B′ and C′ are very similar; see main text). A schematic spectral energy distribution based on the observed X-ray to gamma-ray emission around superior conjunction (adapted from Fig. 9 in Collmar & Zhang 2014; see references therein), which is close to periastron, is also shown.
Current usage metrics show cumulative count of Article Views (full-text article views including HTML views, PDF and ePub downloads, according to the available data) and Abstracts Views on Vision4Press platform.
Data correspond to usage on the plateform after 2015. The current usage metrics is available 48-96 hours after online publication and is updated daily on week days.
Initial download of the metrics may take a while.