Fig. 1.
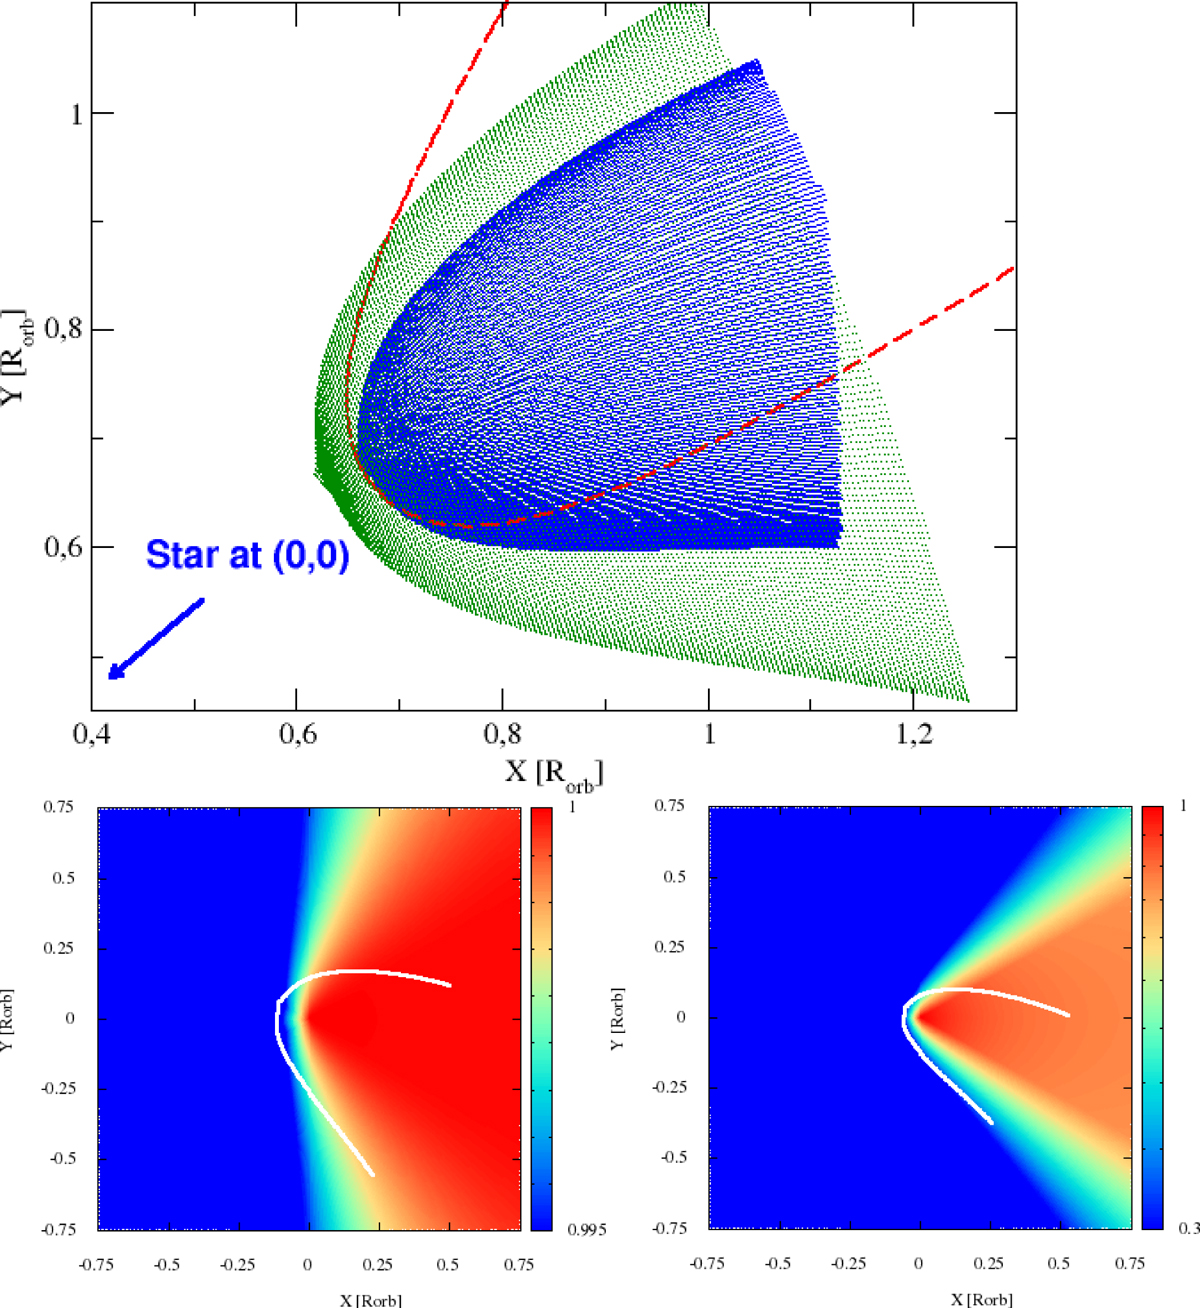
Top panel: orbital plane projection of the computed paths on the CD surface, at periastron, for case A and Γp, 0 = 10 (green; more extended) and 105 (blue; more compact), including orbital motion. The red dashed line shows the profile of the structure for Γp, 0 = 105 when orbital motion is not included. The projected line of sight points along ![]() and the star is at (0, 0). Bottom panel: color maps of the orbital plane of the remaining energy fraction, after IC losses, for particles propagating from the pulsar in all directions, for Γp, 0 = 10 (left) and 105 (right). The white solid lines are the profiles of the projected CD on the orbital plane at periastron for case A including orbital motion. The pulsar is at (0, 0). Both panels: x- and y-axis units are the orbital distance.
and the star is at (0, 0). Bottom panel: color maps of the orbital plane of the remaining energy fraction, after IC losses, for particles propagating from the pulsar in all directions, for Γp, 0 = 10 (left) and 105 (right). The white solid lines are the profiles of the projected CD on the orbital plane at periastron for case A including orbital motion. The pulsar is at (0, 0). Both panels: x- and y-axis units are the orbital distance.
Current usage metrics show cumulative count of Article Views (full-text article views including HTML views, PDF and ePub downloads, according to the available data) and Abstracts Views on Vision4Press platform.
Data correspond to usage on the plateform after 2015. The current usage metrics is available 48-96 hours after online publication and is updated daily on week days.
Initial download of the metrics may take a while.