Fig. 8.
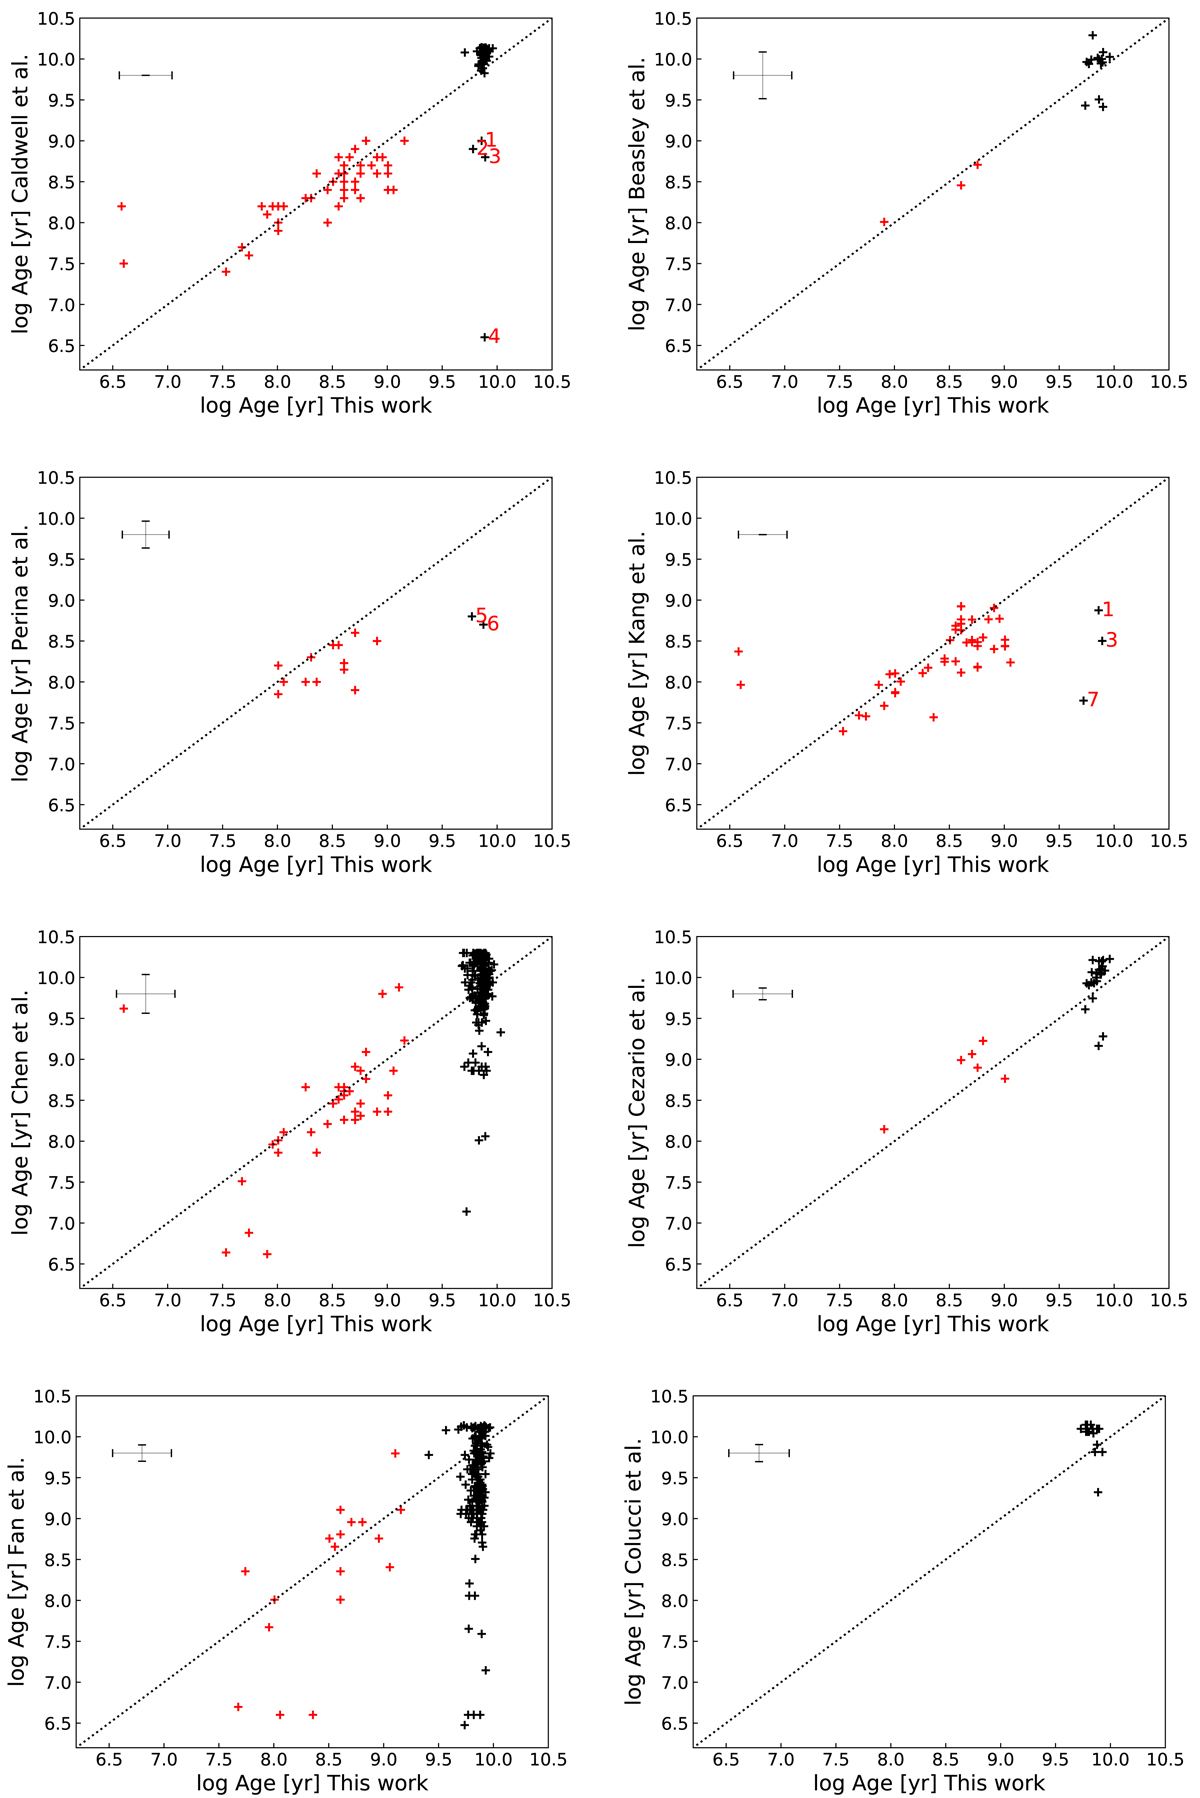
Comparison between our derived ages and those from previous works. Our ages for the young and old clusters are plotted in red and black, respectively. The error bar in each panel shows the median age errors. The red numbers 1−7 are respectively the clusters B316-G040, B349, B089D, B240D-D066, B347-G154, B083-G146, and SK007A.
Current usage metrics show cumulative count of Article Views (full-text article views including HTML views, PDF and ePub downloads, according to the available data) and Abstracts Views on Vision4Press platform.
Data correspond to usage on the plateform after 2015. The current usage metrics is available 48-96 hours after online publication and is updated daily on week days.
Initial download of the metrics may take a while.