Fig. 1.
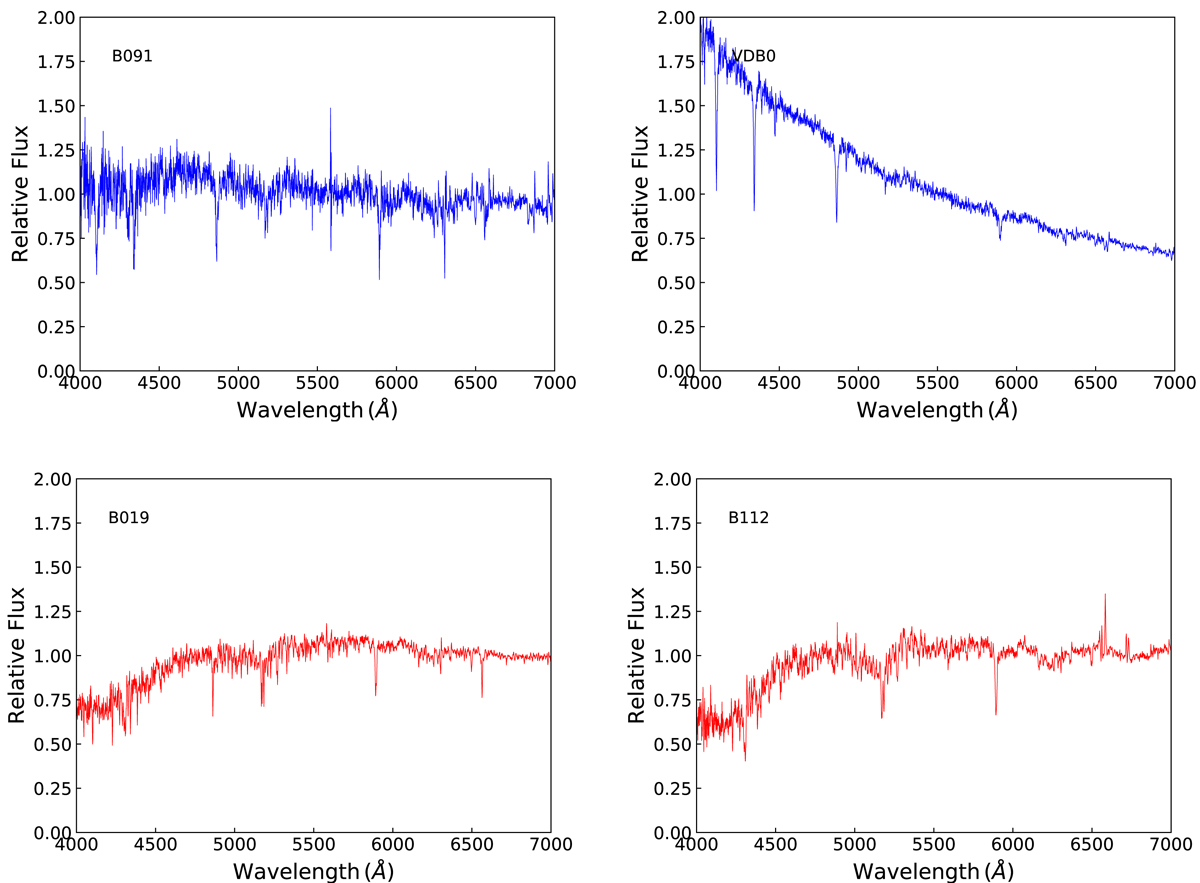
Example LAMOST spectra of four star clusters in our sample. The cluster names are indicated for each spectrum. Upper and lower panels: spectra of two young and two old clusters (in blue and red, respectively). The fluxes are normalized by median values of the individual clusters. To be consistent with our fitting wave band, only spectra in the wavelength range 4000–7000 Å are plotted.
Current usage metrics show cumulative count of Article Views (full-text article views including HTML views, PDF and ePub downloads, according to the available data) and Abstracts Views on Vision4Press platform.
Data correspond to usage on the plateform after 2015. The current usage metrics is available 48-96 hours after online publication and is updated daily on week days.
Initial download of the metrics may take a while.