Fig. 9
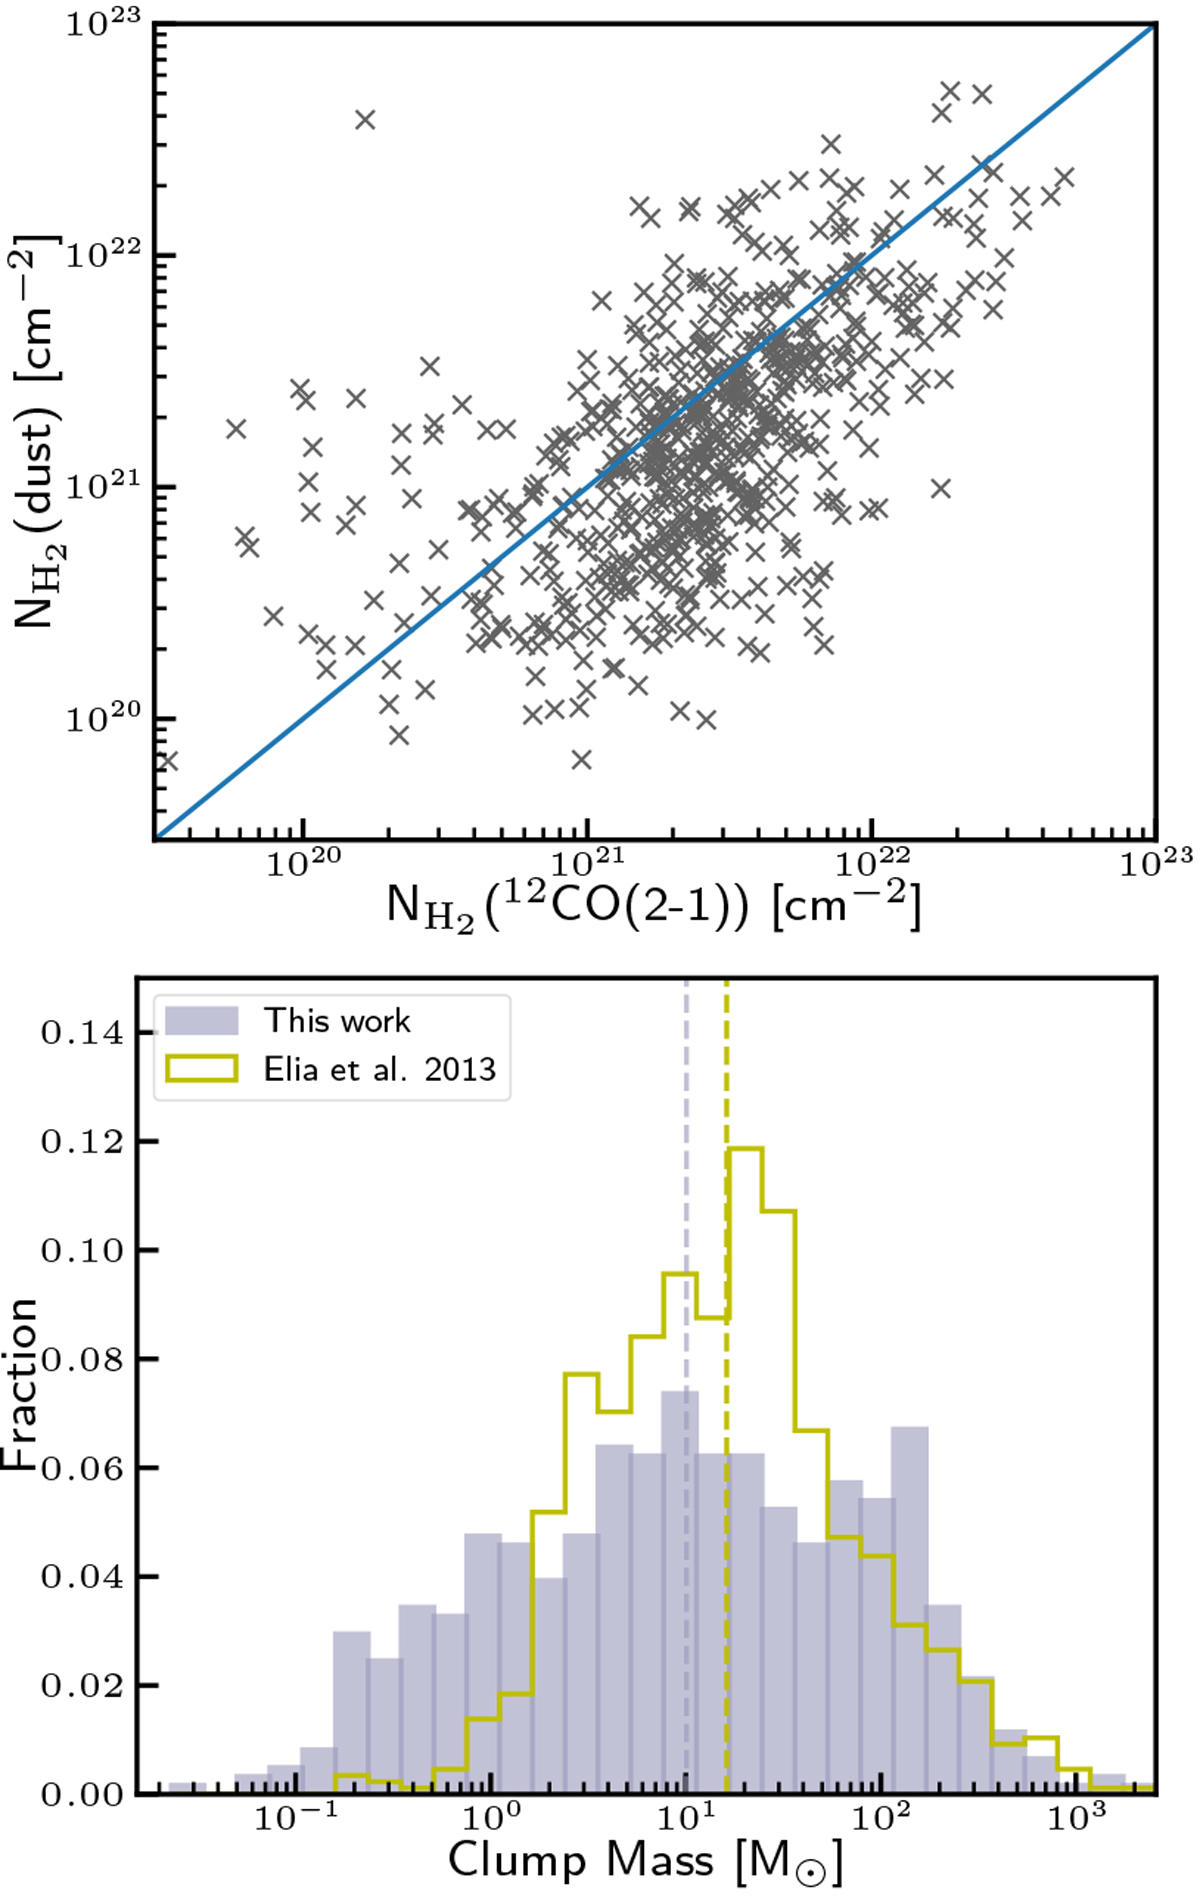
Consistency checks. Top: comparing peak N![]() column densities derived from dust and 12CO(2–1). Equality of both quantities is marked by the solid line. Bottom: clump masses derived from dust continuum emission as calculated for the present work (blue) and from Elia et al. (2013, yellow outline) for 216.5° < ℓ < 225.5° from the dust SEDs.
column densities derived from dust and 12CO(2–1). Equality of both quantities is marked by the solid line. Bottom: clump masses derived from dust continuum emission as calculated for the present work (blue) and from Elia et al. (2013, yellow outline) for 216.5° < ℓ < 225.5° from the dust SEDs.
Current usage metrics show cumulative count of Article Views (full-text article views including HTML views, PDF and ePub downloads, according to the available data) and Abstracts Views on Vision4Press platform.
Data correspond to usage on the plateform after 2015. The current usage metrics is available 48-96 hours after online publication and is updated daily on week days.
Initial download of the metrics may take a while.