Fig. 7
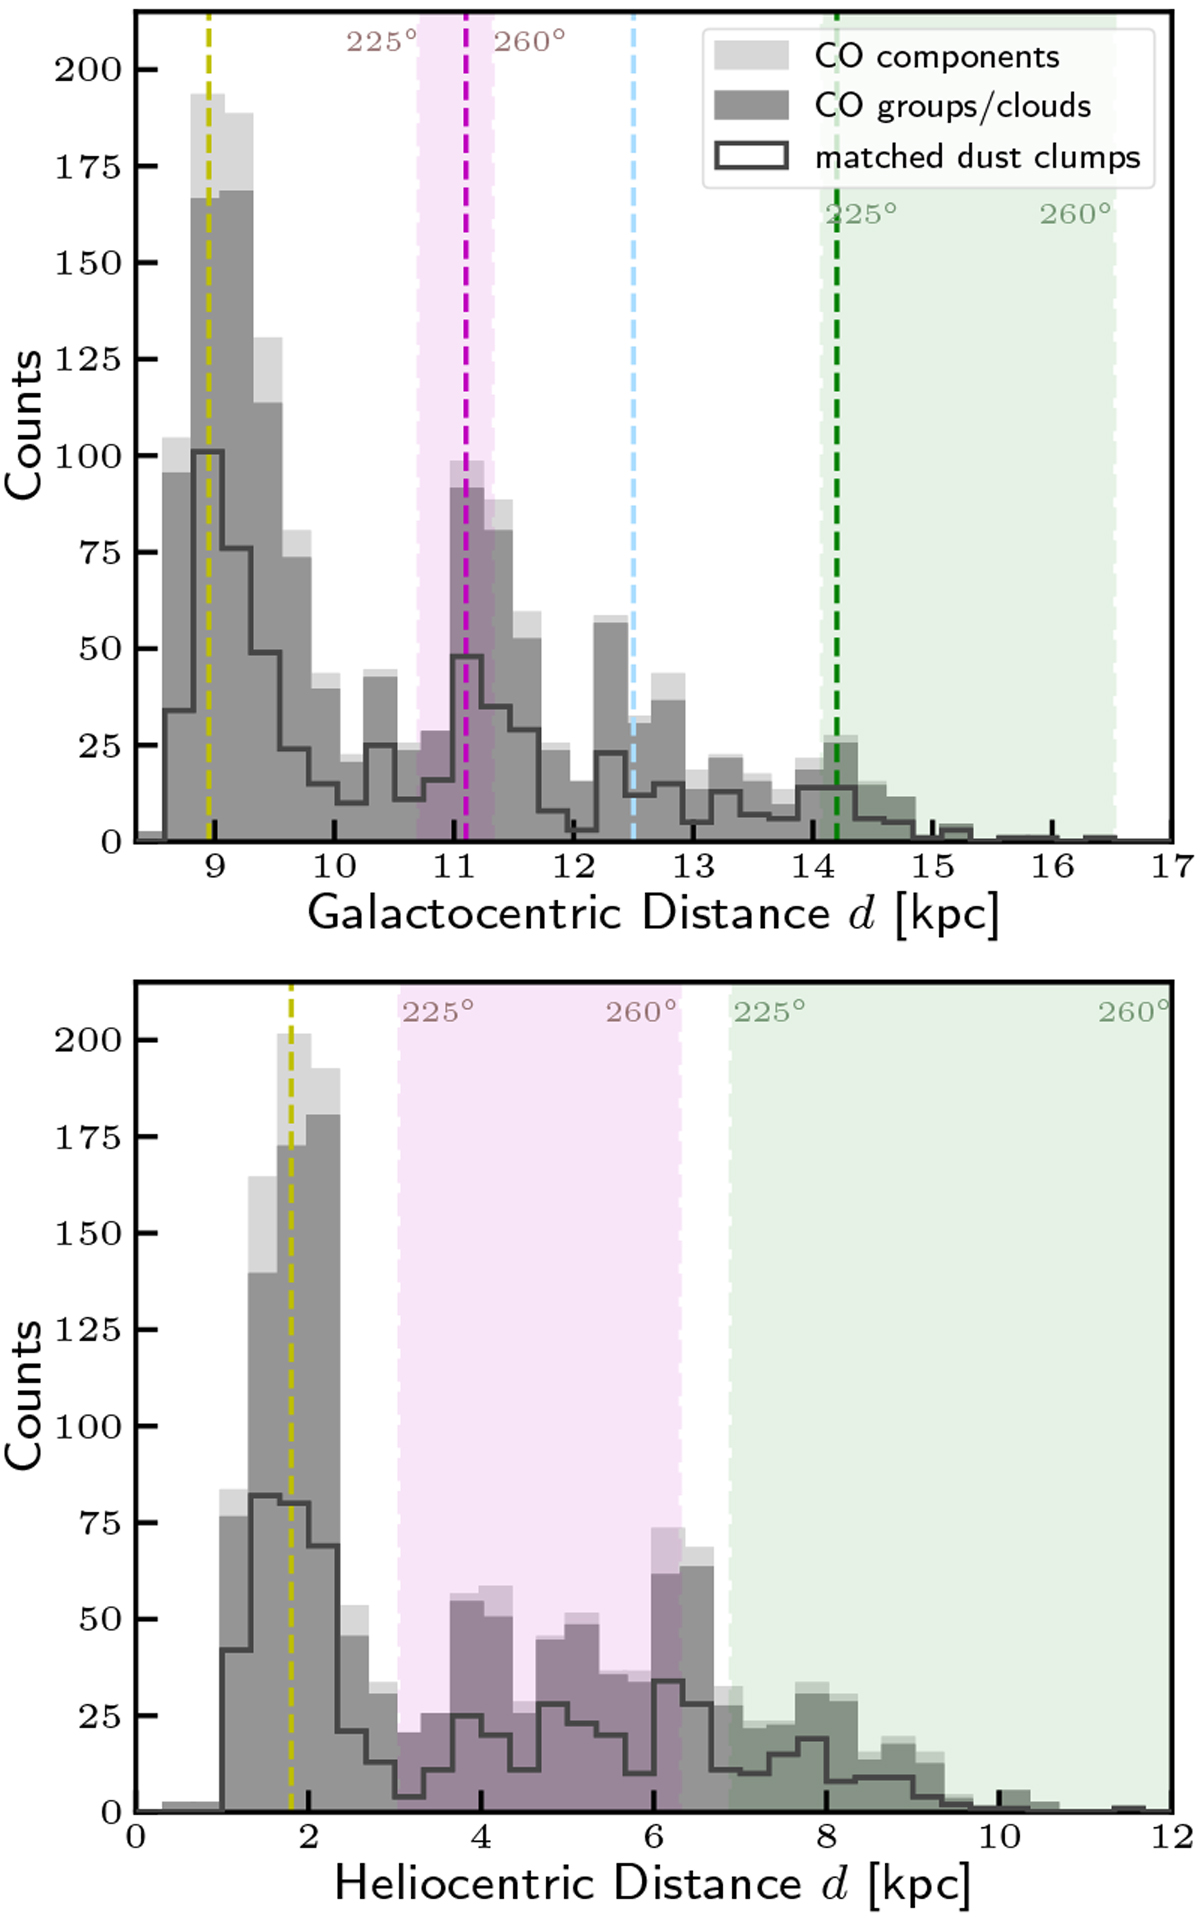
Histograms showing CO velocity components above 5σ (light gray), CO emission groups/clouds (dark gray) and matched dust clumps (black outline) by galactocentric (upper) and heliocentric (lower) distance. The vertical dashed yellow line indicates the peak associated with local emission. The magenta and green shaded areas mark the distance range between 225° ≤ ℓ≤ 260° of theloci of the Perseus and Outer arms, respectively. The two peaks between rgal ~ 12 and ~ 13 kpc correspond to complexes between the Perseus and Outer arm.
Current usage metrics show cumulative count of Article Views (full-text article views including HTML views, PDF and ePub downloads, according to the available data) and Abstracts Views on Vision4Press platform.
Data correspond to usage on the plateform after 2015. The current usage metrics is available 48-96 hours after online publication and is updated daily on week days.
Initial download of the metrics may take a while.