Fig. 5
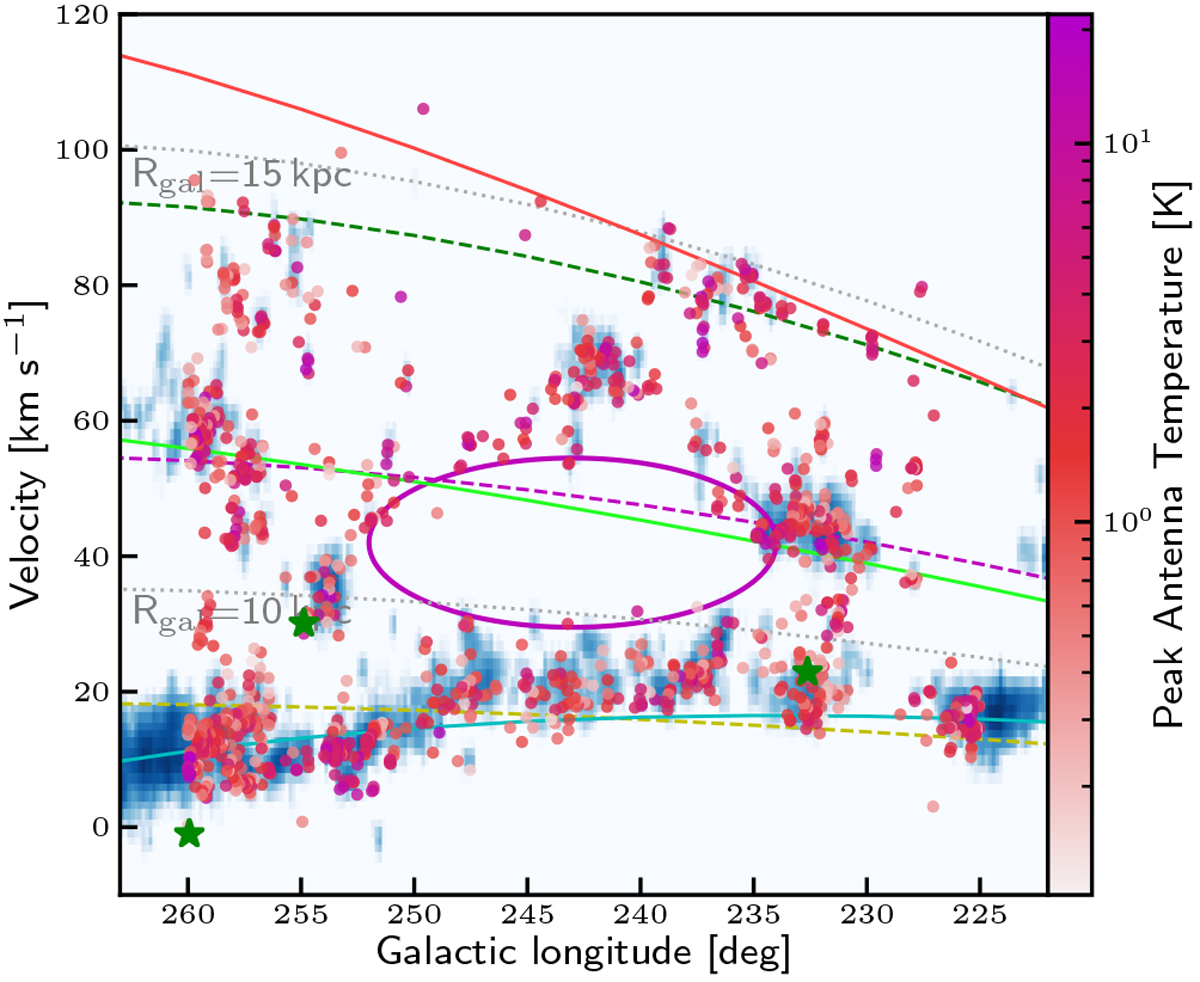
Galactic longitude versus radial velocity. The dots mark all clouds found above 5σ rms between 260° ≤ ℓ ≤ 225°, with the peak antenna temperature color-coded. Background image: CO(1–0) emission from Dame et al. (2001). Dashed yellow, magenta, and green lines: peaks at 9, 11, and 14.0 kpc, respectively, as found in Fig. 7. The spiral arms and the position of the local emission as determined from H I emission are marked by the colored solid lines. Cyan: local emission; green: Perseus arm; red: outer arm. The solid magenta ellipse marks the rim of the Galactic supershell GSH 242-3+77. Gray dashed lines: galactocentric radii at 10 and 15 kpc. The green stars mark the positions of the three sources from the Methanol Multibeam (MMB; Green et al. 2012) survey found in the region.
Current usage metrics show cumulative count of Article Views (full-text article views including HTML views, PDF and ePub downloads, according to the available data) and Abstracts Views on Vision4Press platform.
Data correspond to usage on the plateform after 2015. The current usage metrics is available 48-96 hours after online publication and is updated daily on week days.
Initial download of the metrics may take a while.