Fig. 4
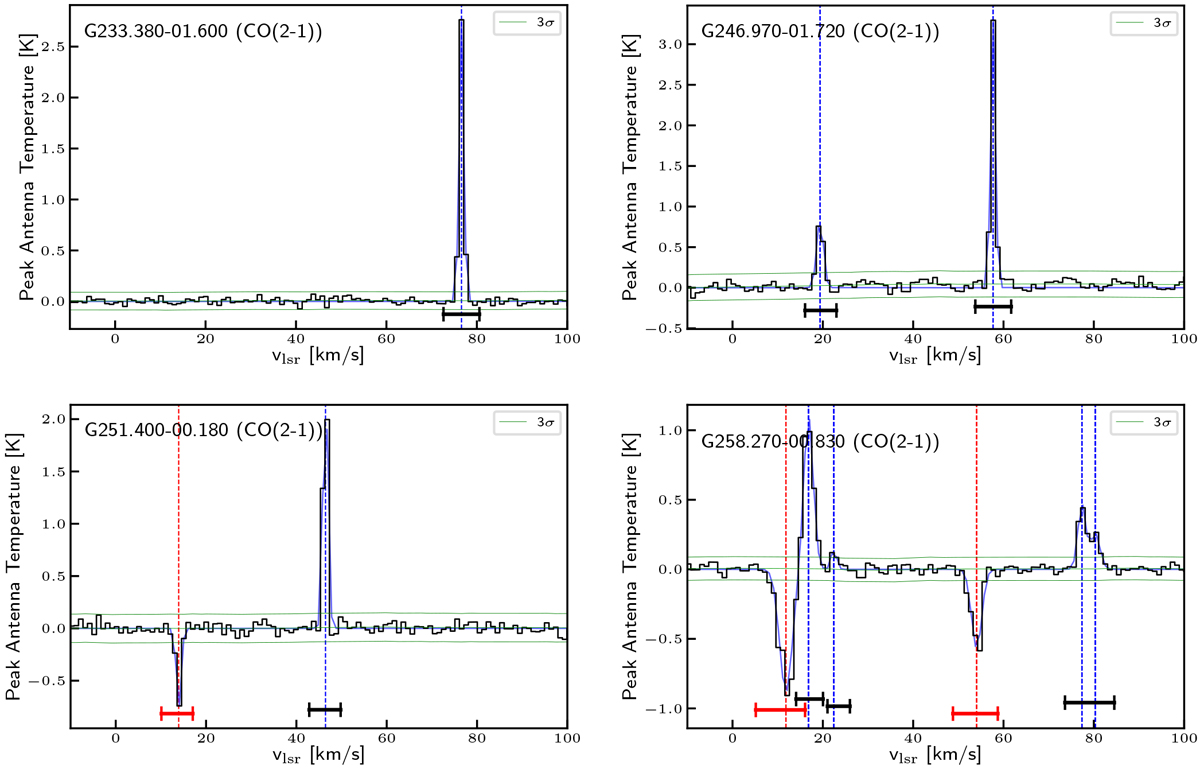
12CO(2–1) spectra (black line) showing different typical profiles: single component (upper left), multiple components (upper right), simple contamination in the off-position (lower left), and a complex spectrum with all features (lower right). The total fit spectrum is overplotted in blue. Coherent velocity complexes are either marked as black (source position) or red (off position; negative features) horizontal bars below the spectrum. The vertical dashed blue lines indicate the peak positions of the fit Gaussian profiles, whereas the vertical red dashed lines indicate the peak position of the emission found in theoff-position.
Current usage metrics show cumulative count of Article Views (full-text article views including HTML views, PDF and ePub downloads, according to the available data) and Abstracts Views on Vision4Press platform.
Data correspond to usage on the plateform after 2015. The current usage metrics is available 48-96 hours after online publication and is updated daily on week days.
Initial download of the metrics may take a while.