Fig. 16
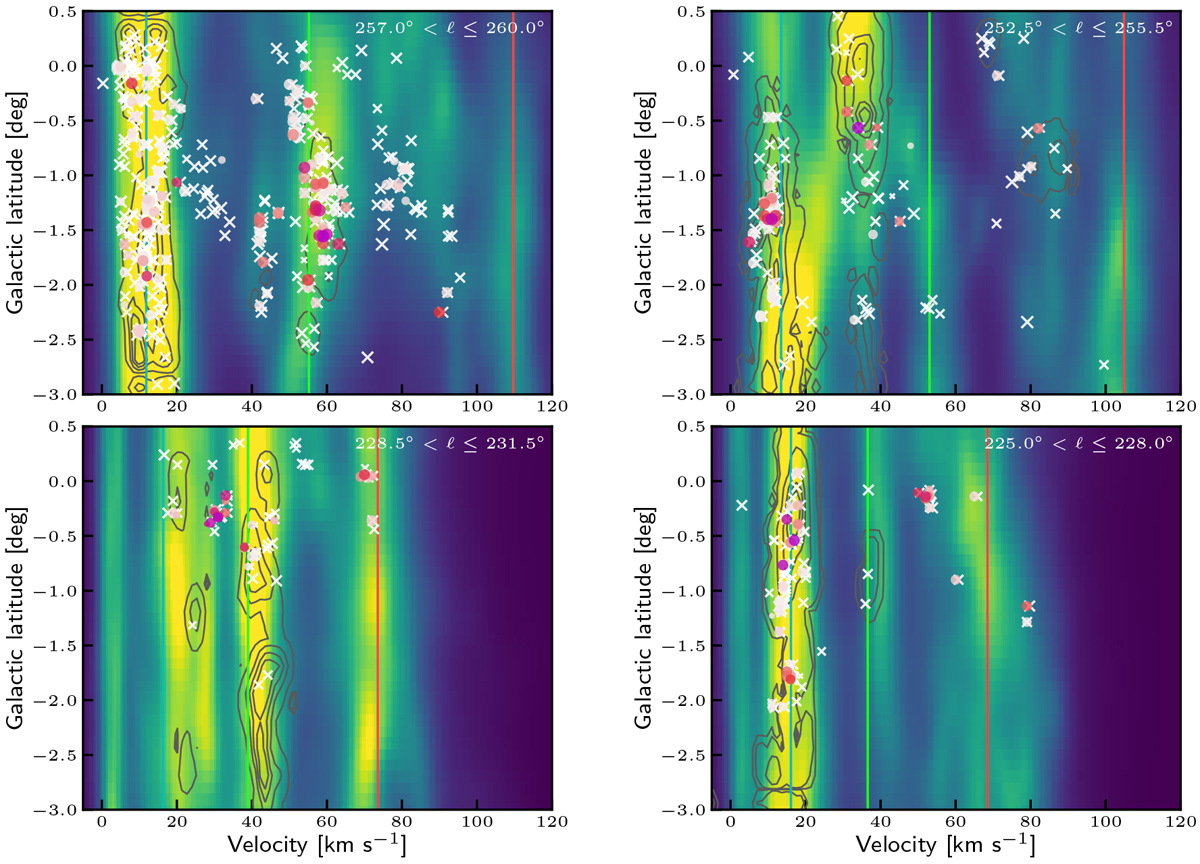
Selected slices of Galactic latitude versus radial velocity integrated over 3° in Galactic longitude away from the Galactic supershell (top: higher longitudes than shell, bottom: lower longitudes of the shell). Crosses mark the CO(2–1) velocity components along a line of sight, with colored dots indicating associated dust clumps. Sizes correspond to the integrated line intensity and the colors reflect ongoing star formation as indicated by the 22 μm WISE emission. The background image shows the corresponding H I integrated intensity from the GASS survey (McClure-Griffiths et al. 2004). The contours mark the CO(1–0) emission from Dame et al. (2001) at levels of 5σ, 7σ, and the 10th, 30th, 50th and 70th percentiles. The spiral arms as determined in the present work and the position of the local emission are marked by the colored solid lines. Cyan: local emission; green: Perseus arm; red: outer arm.
Current usage metrics show cumulative count of Article Views (full-text article views including HTML views, PDF and ePub downloads, according to the available data) and Abstracts Views on Vision4Press platform.
Data correspond to usage on the plateform after 2015. The current usage metrics is available 48-96 hours after online publication and is updated daily on week days.
Initial download of the metrics may take a while.