Fig. 13
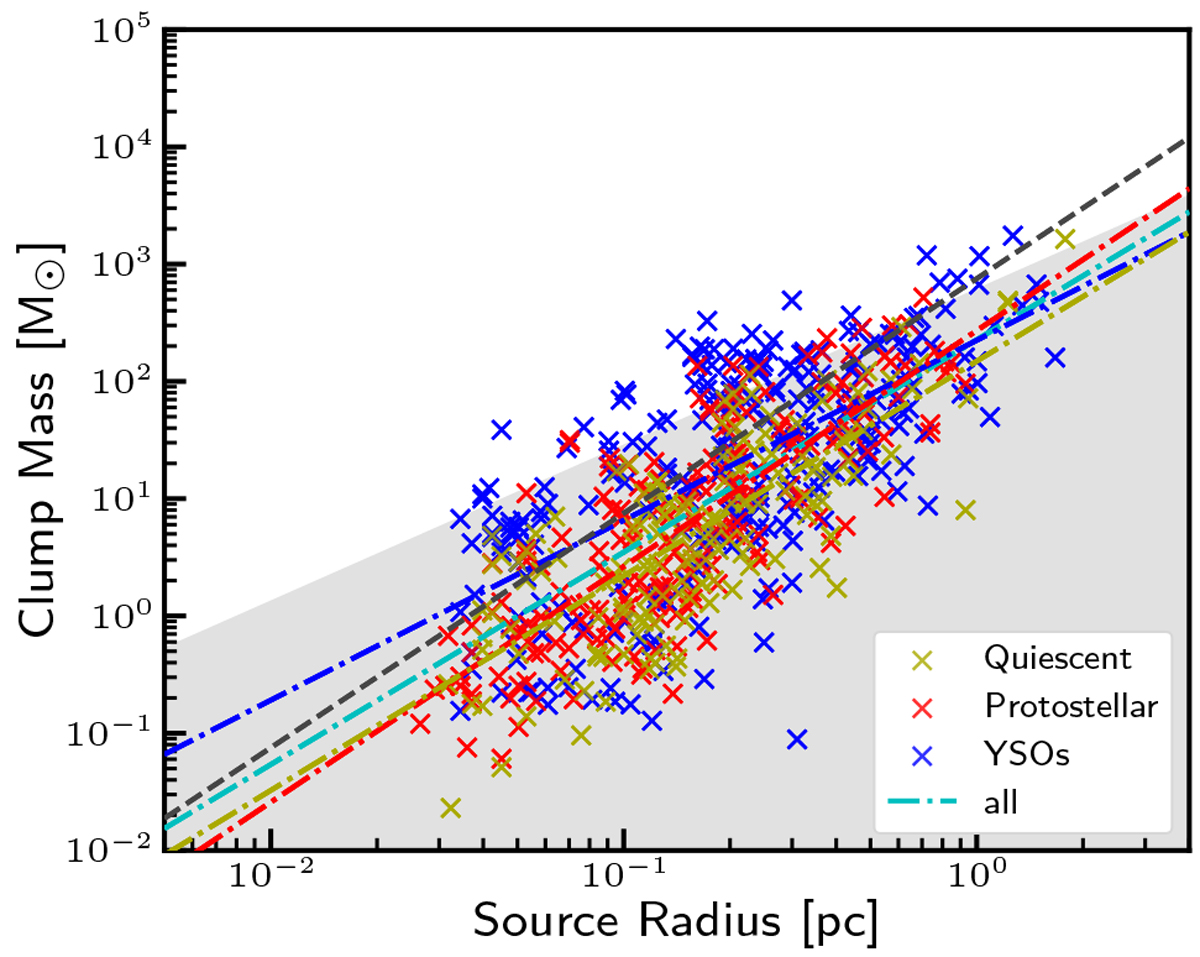
Clump mass versus source radius. The shaded area marks the regime where only low-mass stars form, as determined by Kauffmann et al. (2010). The black dashed line marks the lower limit for effective high-mass star formation as determined by Urquhart et al. (2014c), indicating a surface density threshold of 0.05 g cm−2. The horizontal gray dotted line marks the threshold of 8 M⊙, above whicha clump is considered massive. The colored dash-dotted lines are linear fits to the corresponding subsamples, and the cyan dash-dotted line is a fit to the full sample.
Current usage metrics show cumulative count of Article Views (full-text article views including HTML views, PDF and ePub downloads, according to the available data) and Abstracts Views on Vision4Press platform.
Data correspond to usage on the plateform after 2015. The current usage metrics is available 48-96 hours after online publication and is updated daily on week days.
Initial download of the metrics may take a while.